Adrenal imaging: A three-category approach to managing incidentalomas
Images
This article is accredited for one SA-CME credit. Visit appliedradiology.org/SAM2 for full SA-CME information.
Advances in imaging technology have led to improvements in the detection and diagnosis of adrenal pathology. Imaging now plays a critical role in the work-up and clinical management of adrenal disease. Because masses in the adrenal glands are one of the most commonly encountered incidentalomas, the American College of Radiology (ACR) has developed specific recommendations on how to manage incidentally discovered adrenal masses in the adult population. The purpose of this article is to review the imaging appearance of common adrenal diseases and to provide a diagnostic imaging algorithm for work-up of the “adrenal incidentaloma” based on guidelines published in the ACR White Paper on management of incidental findings.1,2
Three types of adrenal masses
Most adrenal masses can be divided into three broad categories. The first category consists of lesions known as “Aunt Minnies.” These lesions can be diagnosed immediately and with high degree of certainty so that no further imaging work-up is necessary. The second category consists of incidentalomas, which cannot be diagnosed on initial discovery, but require further imaging to elucidate their nature. The ACR White Paper provides a helpful decision tree to determine the most appropriate imaging test to work-up the incidental adrenal lesion. The third category comprises adrenal “conundrums,” which are lesions that remain indeterminate after dedicated adrenal imaging. In these cases, image-guided adrenal biopsy may be performed for definitive diagnosis.
Adrenal “Aunt Minnies”
This group of adrenal masses can be correctly diagnosed with a high degree of certainty based on their imaging appearance.3 They include myelolipomas, cysts, and lipid-rich adenomas.
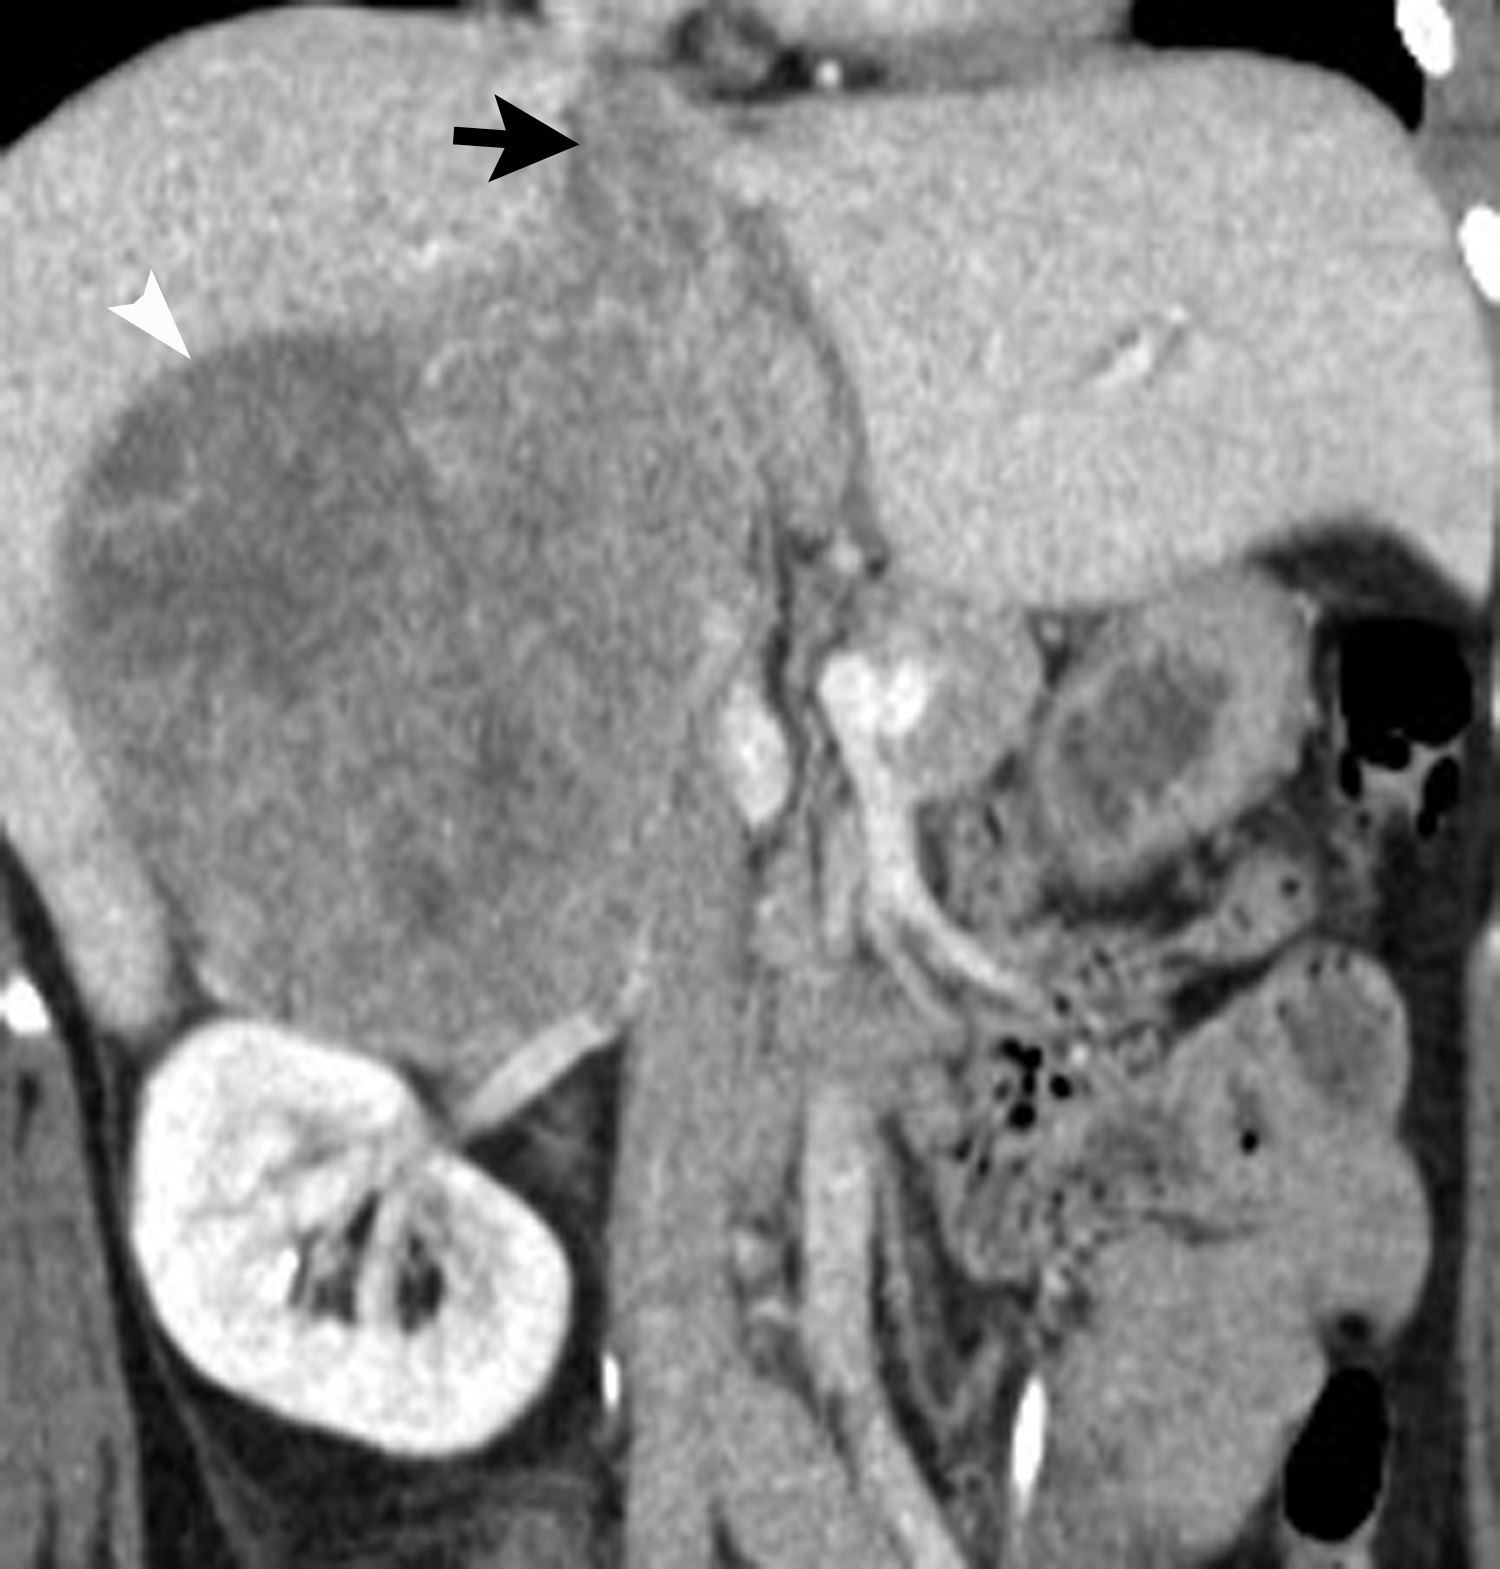
Myelolipomas are benign tumors composed of fat and hematopoietic tissue. Pathologically, these tumors can resemble bone marrow. They typically contain variable quantities of macroscopic fat that is easily detected on CT and MRI (Figure 1). On CT, the areas of fat attenuation measure between -150 HU to -30 HU.4 These tumors can contain calcifications and evidence of hemorrhage if they get large (>5 cm).5 On MRI, areas of fat within myelolipomas parallel the signal of retroperitoneal fat.5-7 On FDG-PET/CT, myelolipomas typically show FDG uptake lower than that of liver background. Rarely, myelolipomas with dominant adenomatous and hematopoietic tissue can have high FDG avidity.8
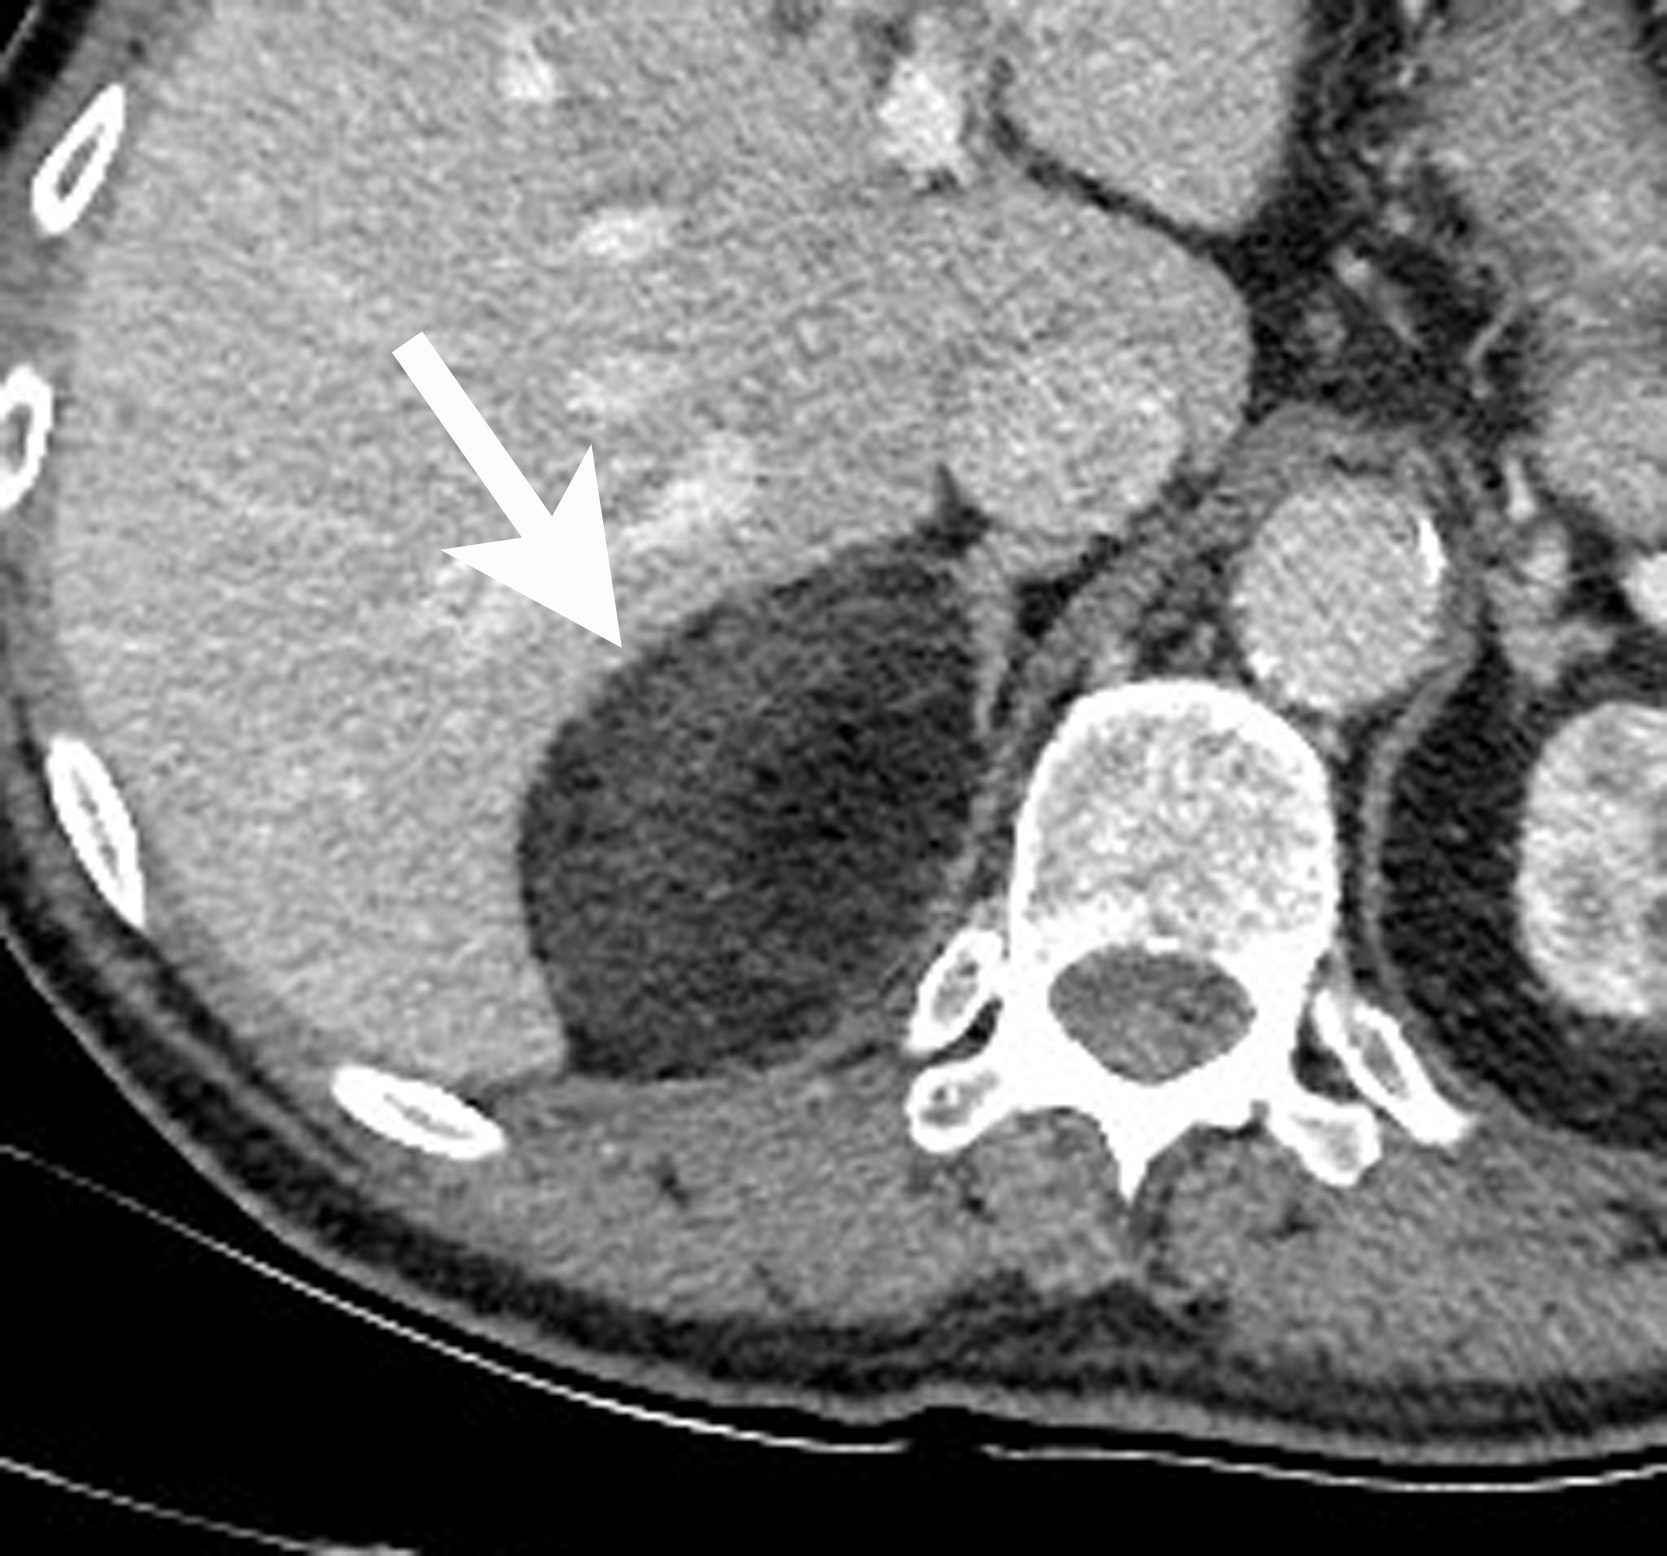
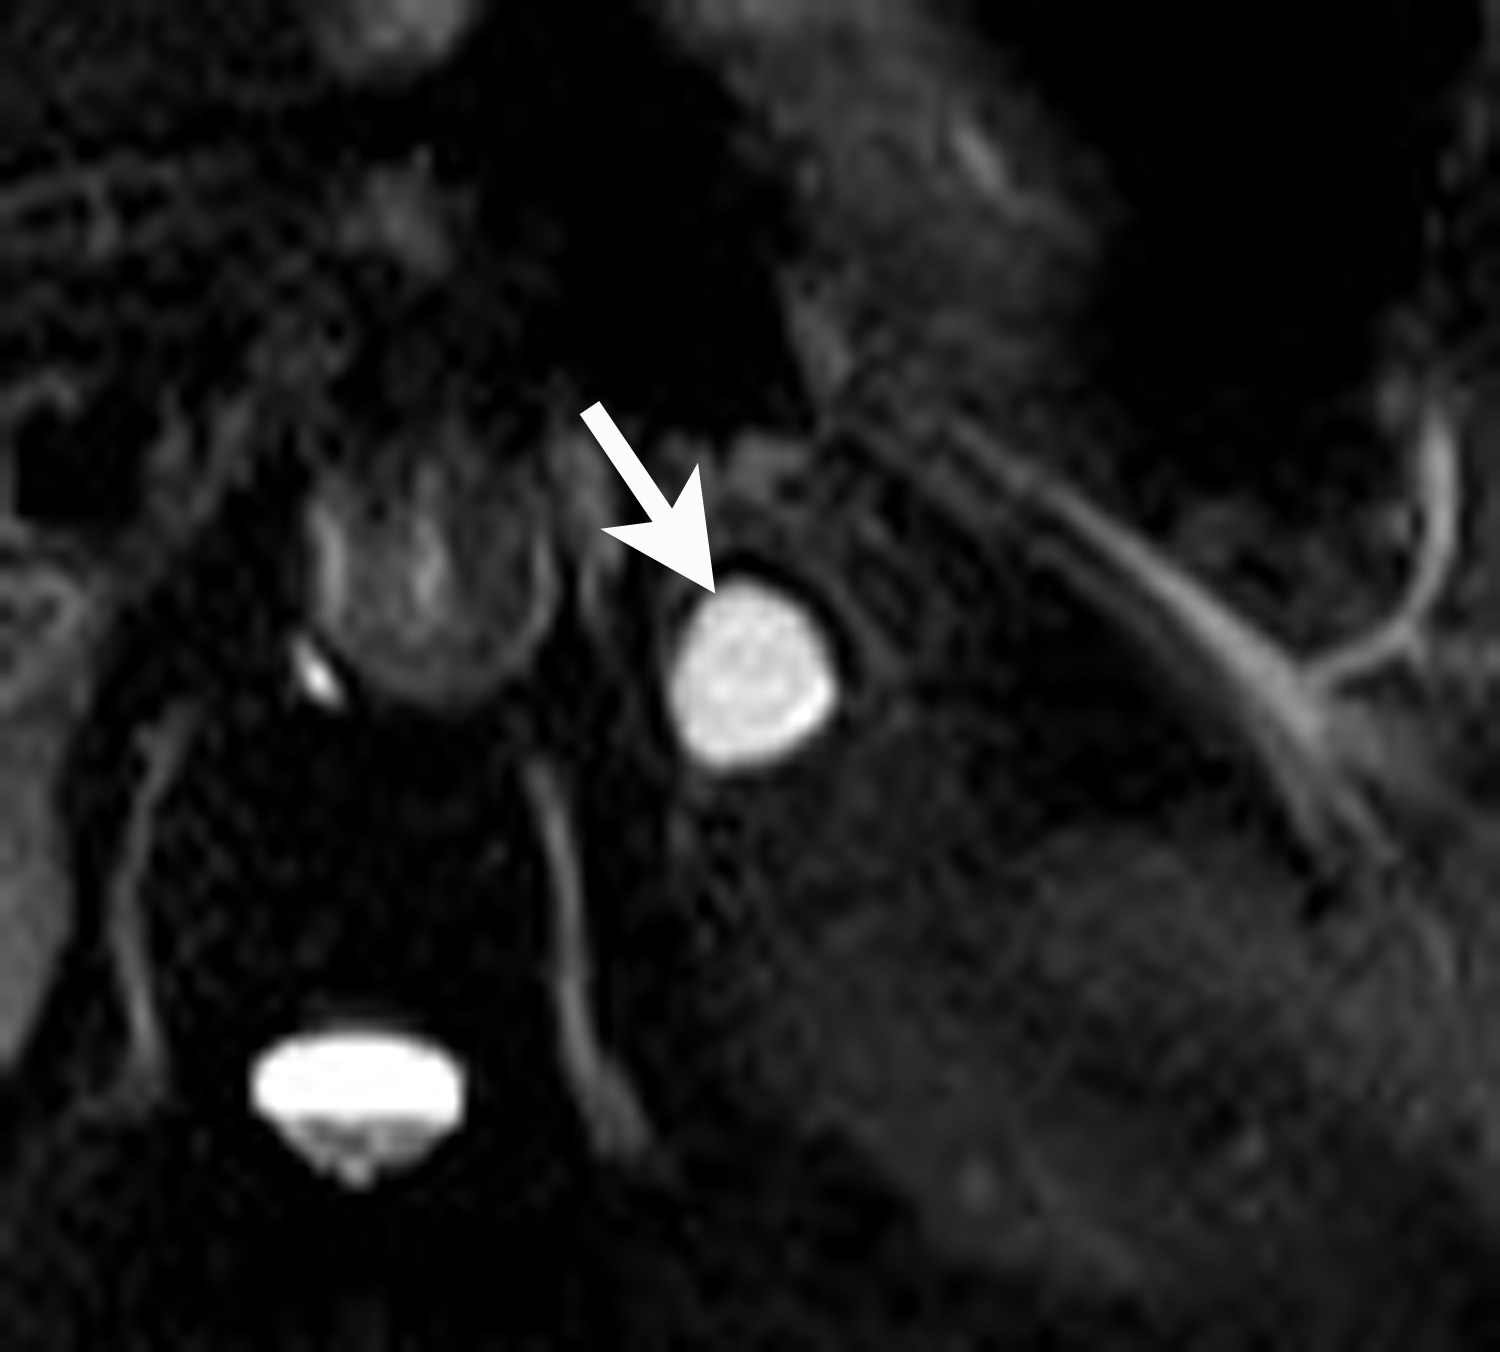
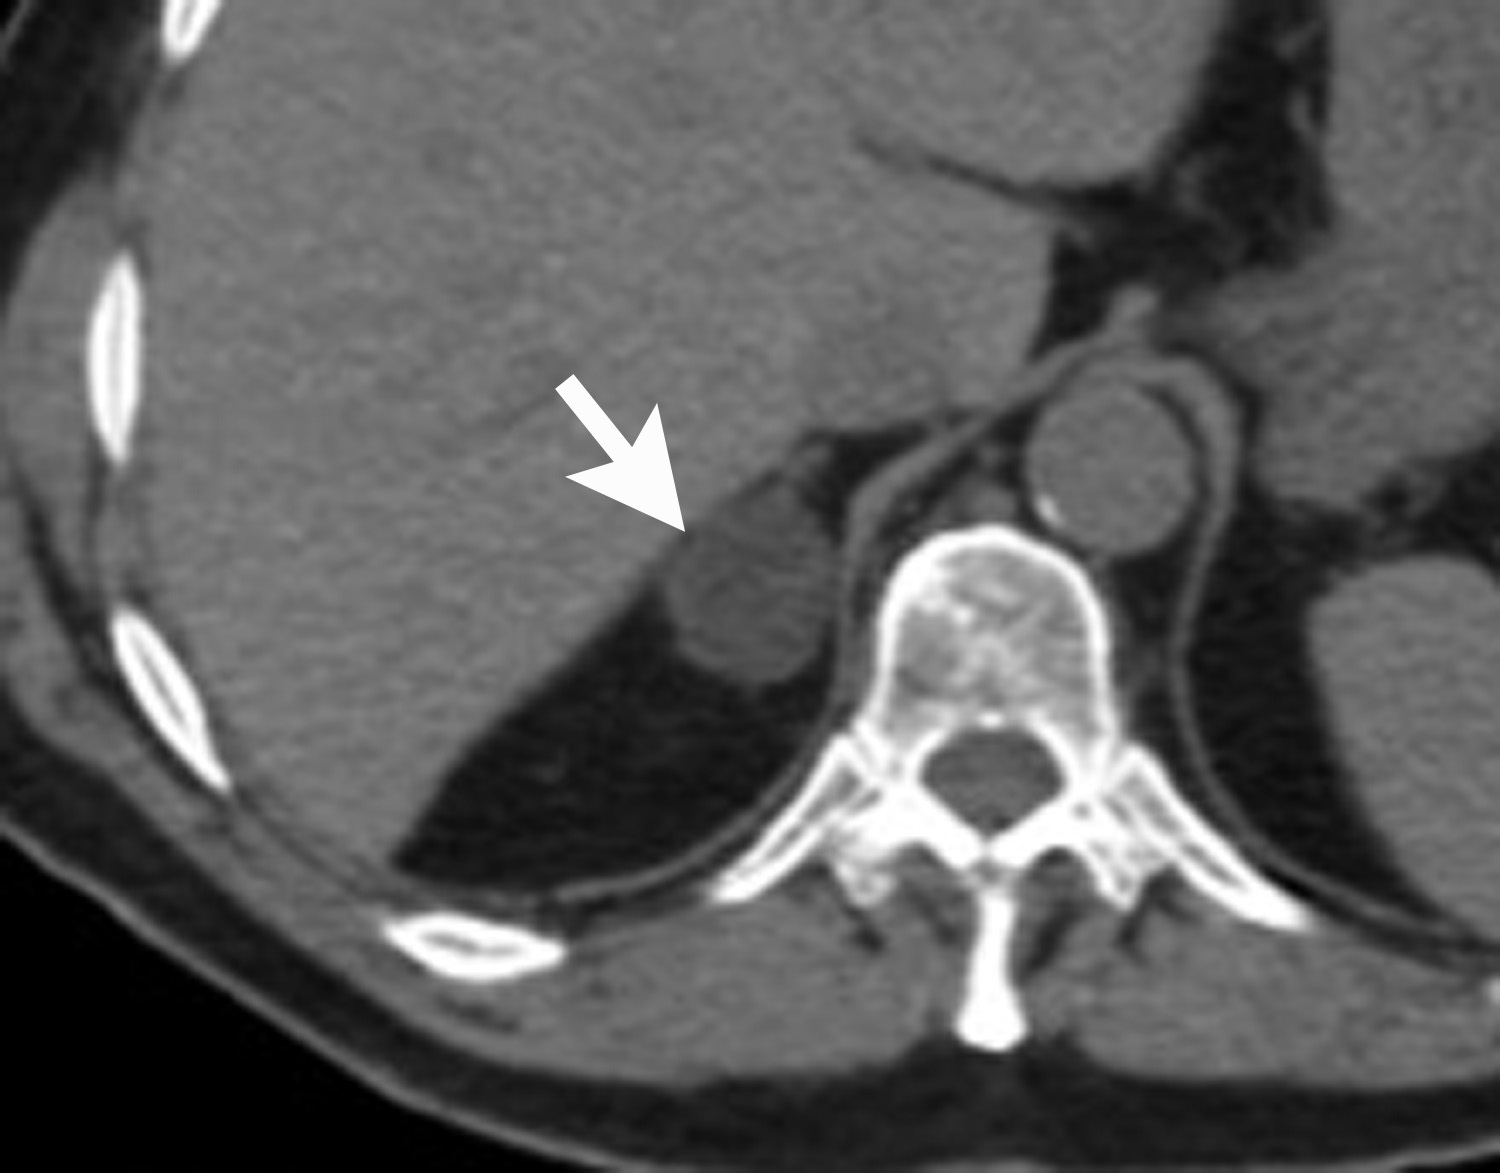
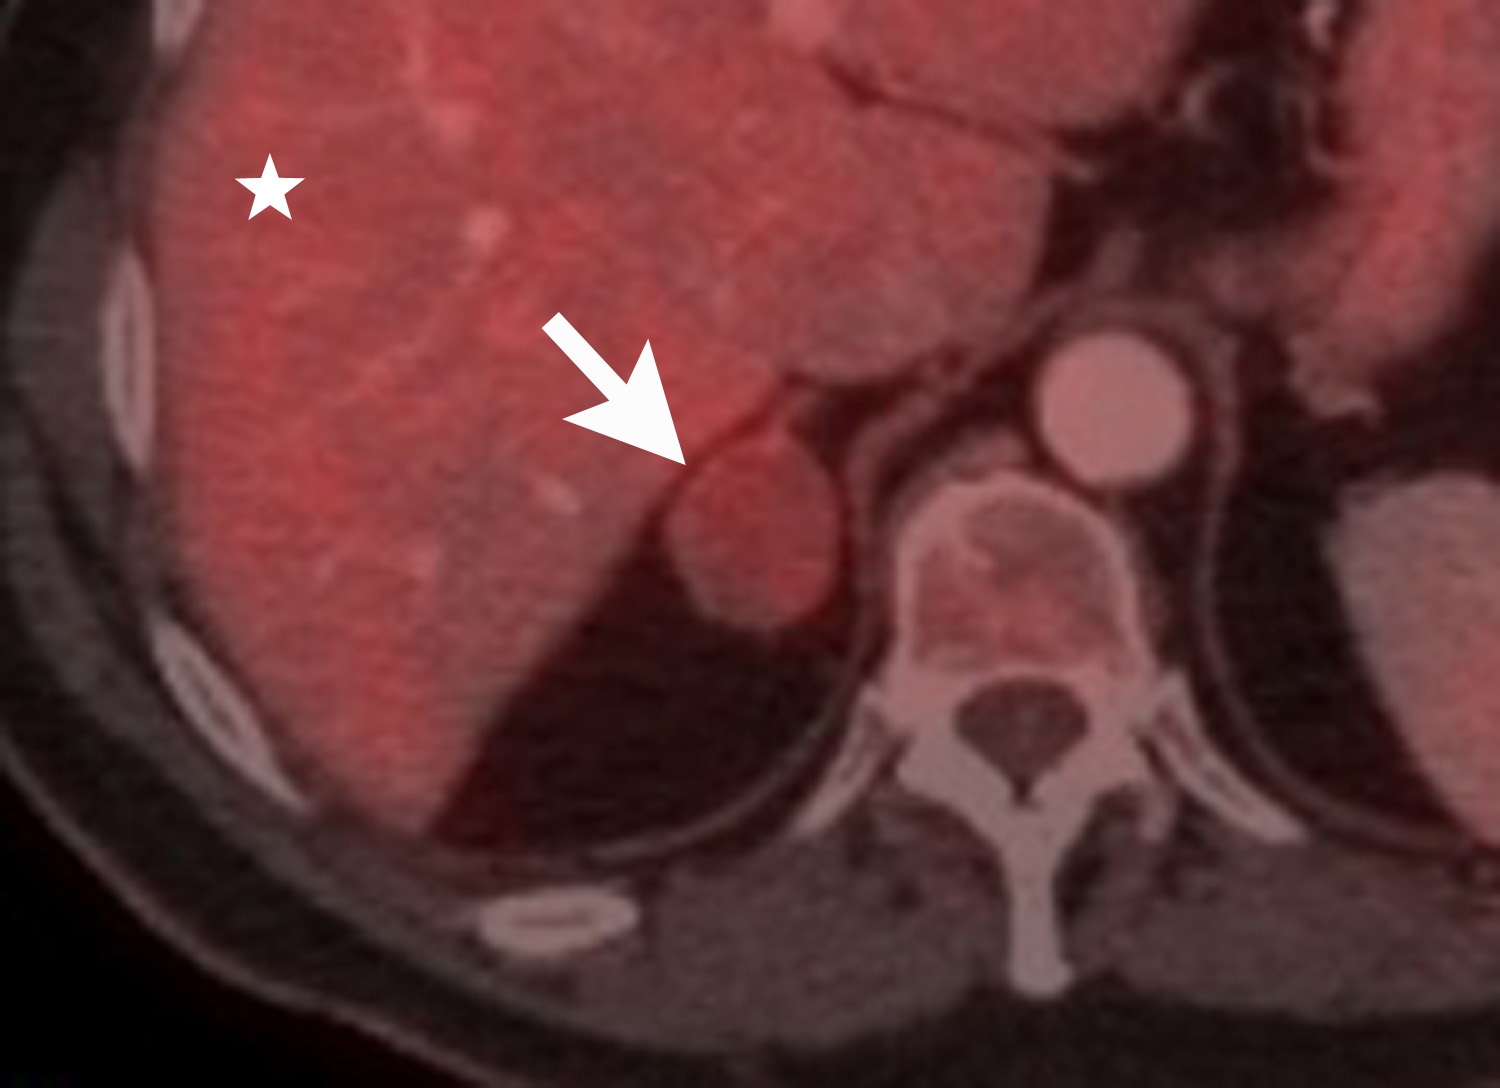
Adrenal cysts are rare but can be easily diagnosed on CT or MRI. On CT, the typical adrenal cyst has a Hounsfield attenuation close to that of water (< 20 HU) and it does not enhance. On MRI, these lesions demonstrate homogeneous high signal on T2-weighted images and do not enhance (Figure 2). Most adrenal cysts are of endothelial origin or pseudocysts from prior inflammatory process.9
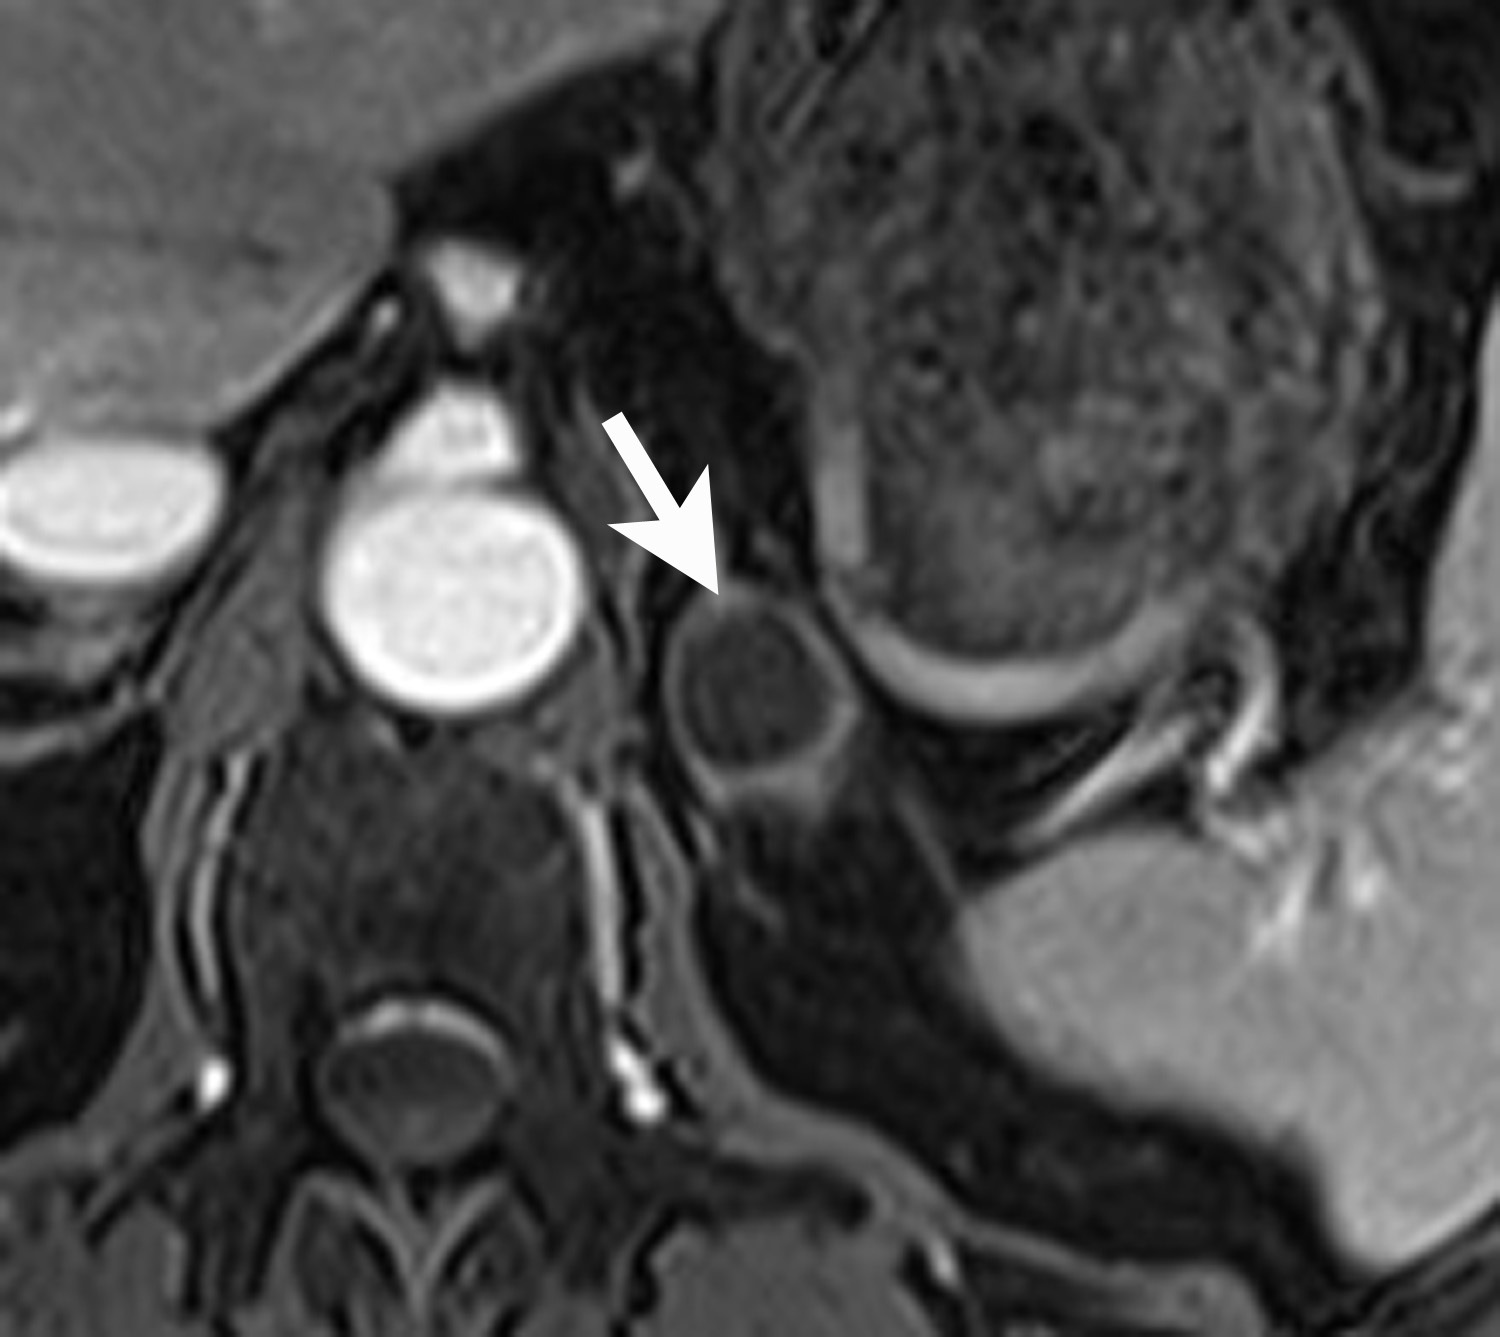
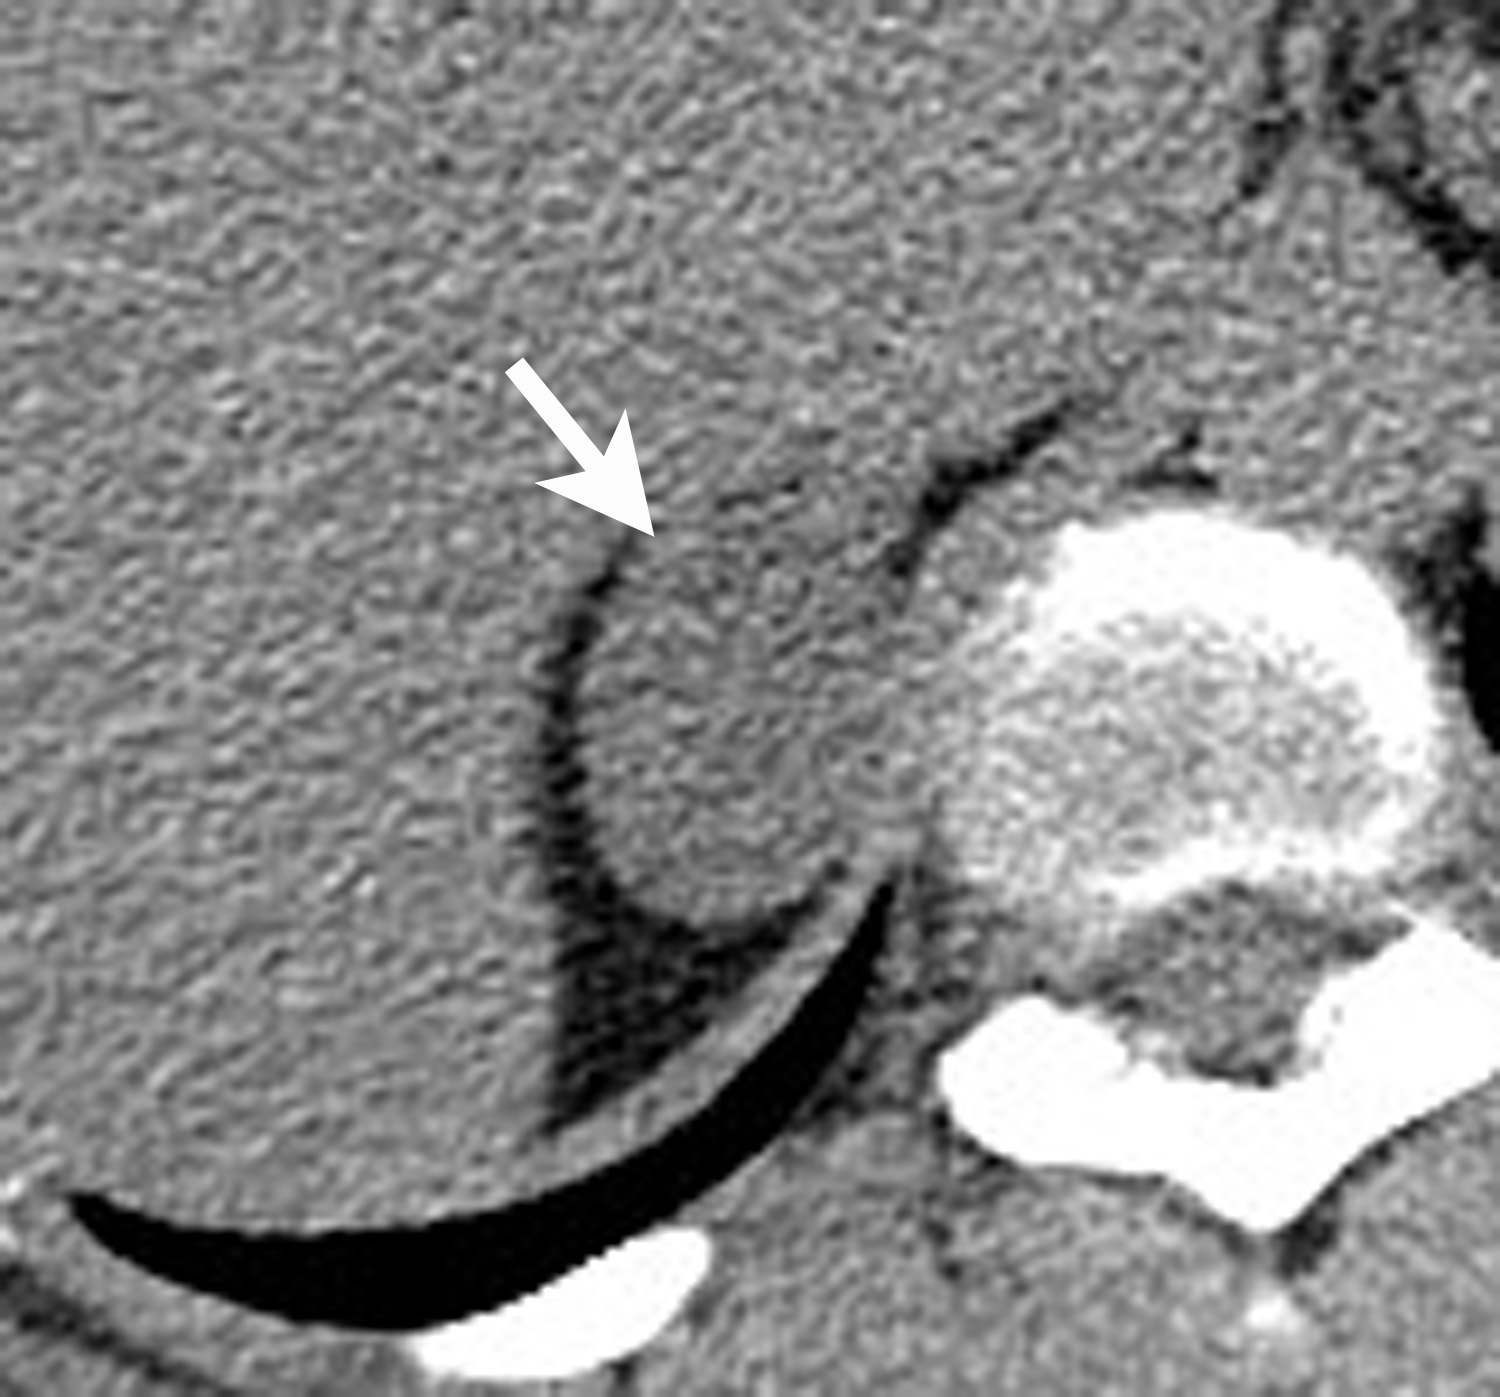
Lipid-rich adenomas are the most common tumor of the adrenal gland. The overall prevalence of adenomas in the general population is estimated at approximately 4-6% and the frequency increases with age. These are benign tumors derived from the adrenal cortex. The vast majority of adenomas are non-hyperfunctioning.10 Approximately 70% of adrenal adenomas can be termed “lipid rich” owing to the large amount of intracellular lipid within these tumors. Because of this abundant intracellular lipid, these tumors typically have low CT attenuation on non-enhanced CT (Figure 3). A threshold value of less than or equal to +10 Hounsfield attenuation units (HU) has become the reference standard for diagnosis of lipid-rich adenoma on non-enhanced CT, since this threshold value was first proposed by Boland et al. in 1998.11
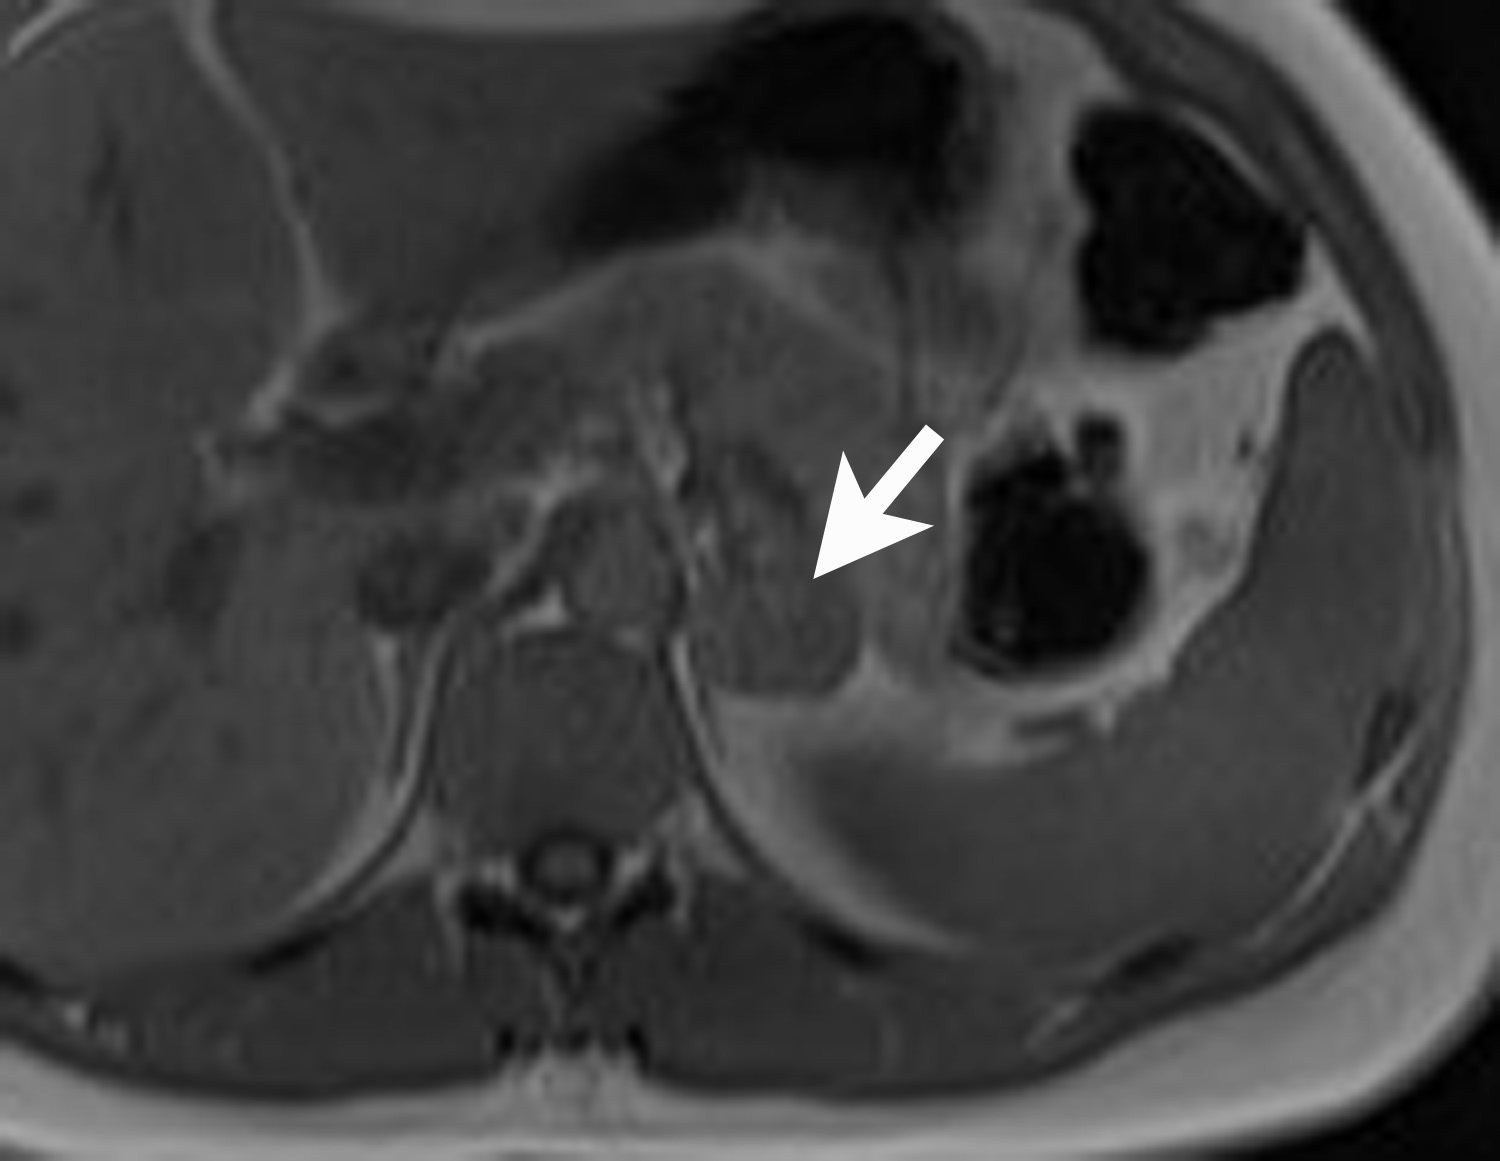
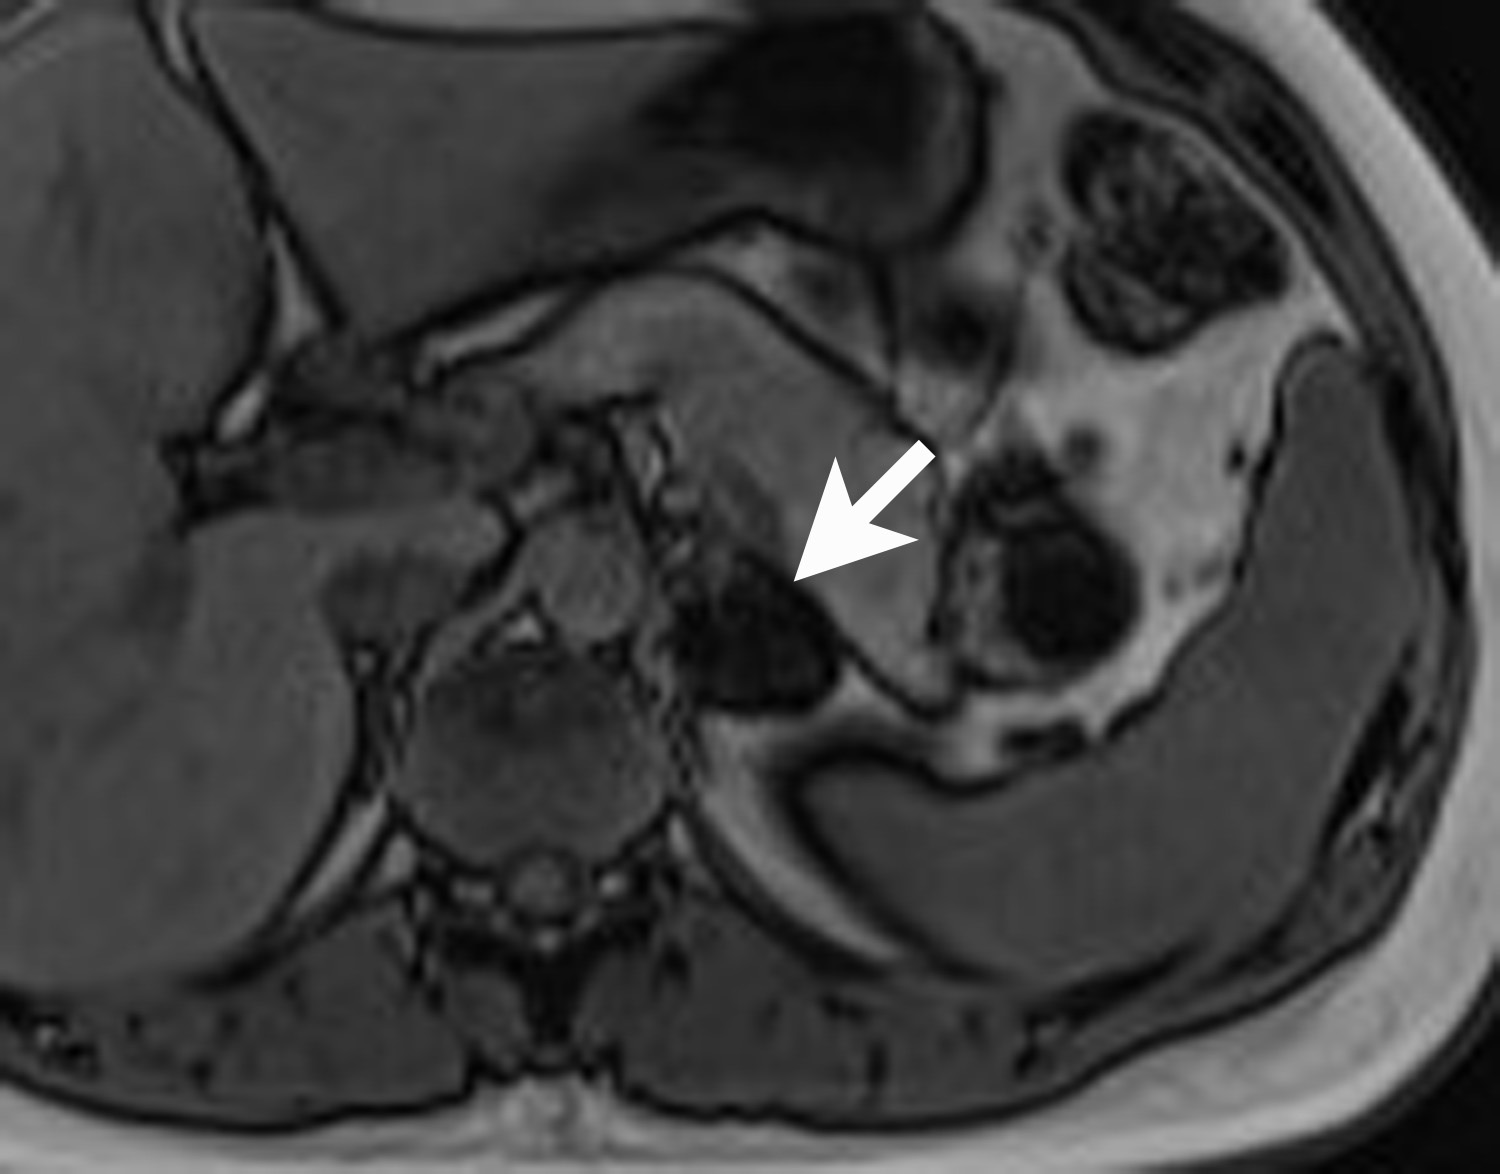
Lipid-rich adenomas are also easily diagnosed on chemical shift MRI, using breath-held dual-echo T1-weighted, gradient-recalled echo (GRE), acquired in-phase and opposed phase. Because fat protons precess at a lower frequency than water protons, at a given time to echo (TE), their frequency signals will be either be additive (in-phase) or cancel each other out (opposed-phase). Thus, owing to the presence of intracellular lipid, adenomas can be differentiated from non-adenomas such as metastases by demonstrating signal cancellation on opposed-phase images (Figure 4). The choice of TE to perform chemical shift imaging depends on the strength of the external magnetic field. At 1.5 Tesla, a TE of 2.2 msecs corresponds to when fat and water are opposed-phase and a TE of 4.4 msecs corresponds to when fat and water are in-phase. With lipid-rich adenomas, the signal loss on opposed phase images is usually dramatic and signal “dropout” is easily determined visually or qualitatively by comparing the in-phase images with the opposed-phase images.12 Signal loss on opposed phase images can also be measured quantitatively by measuring the signal intensity index. Demonstrating a signal intensity index value >16.5% is consistent with an adrenal adenoma. The formula for signal intensity index is as follows:
Signal Intensity Index = [(Signal in-phase) – (Signal opposed-phase)/ (Signal in-phase)] × 100.13
Adrenal incidentalomas
Most adrenal masses are discovered serendipitously during a contrast-enhanced CT performed for reasons other than evaluation of adrenal disease. The majority of these adrenal incidentalomas are caused by adrenal adenomas. However, because adrenal adenomas cannot be definitively diagnosed on a routine contrast-enhanced CT, a plan of action or imaging algorithm is needed to distinguish adenomas from nonadenomas (eg, metastases). The ACR White Paper presents a flowchart for how to proceed when confronted with an adrenal incidentaloma.1,2 Incidental adrenal lesions measuring greater than 4 cm should be considered for surgical consultation or biopsy due to increased risk of malignancy. Incidental adrenal lesions measuring between 1 cm and 2 cm, with no history of cancer are likely benign. In these cases, the ACR recommends 1-year followup with dedicated adrenal CT or chemical shift MRI. For incidental adrenal lesions measuring between 2 cm and 4 cm, dedicated adrenal CT or chemical shift MRI can be considered at the time of initial discovery to confirm benignity.
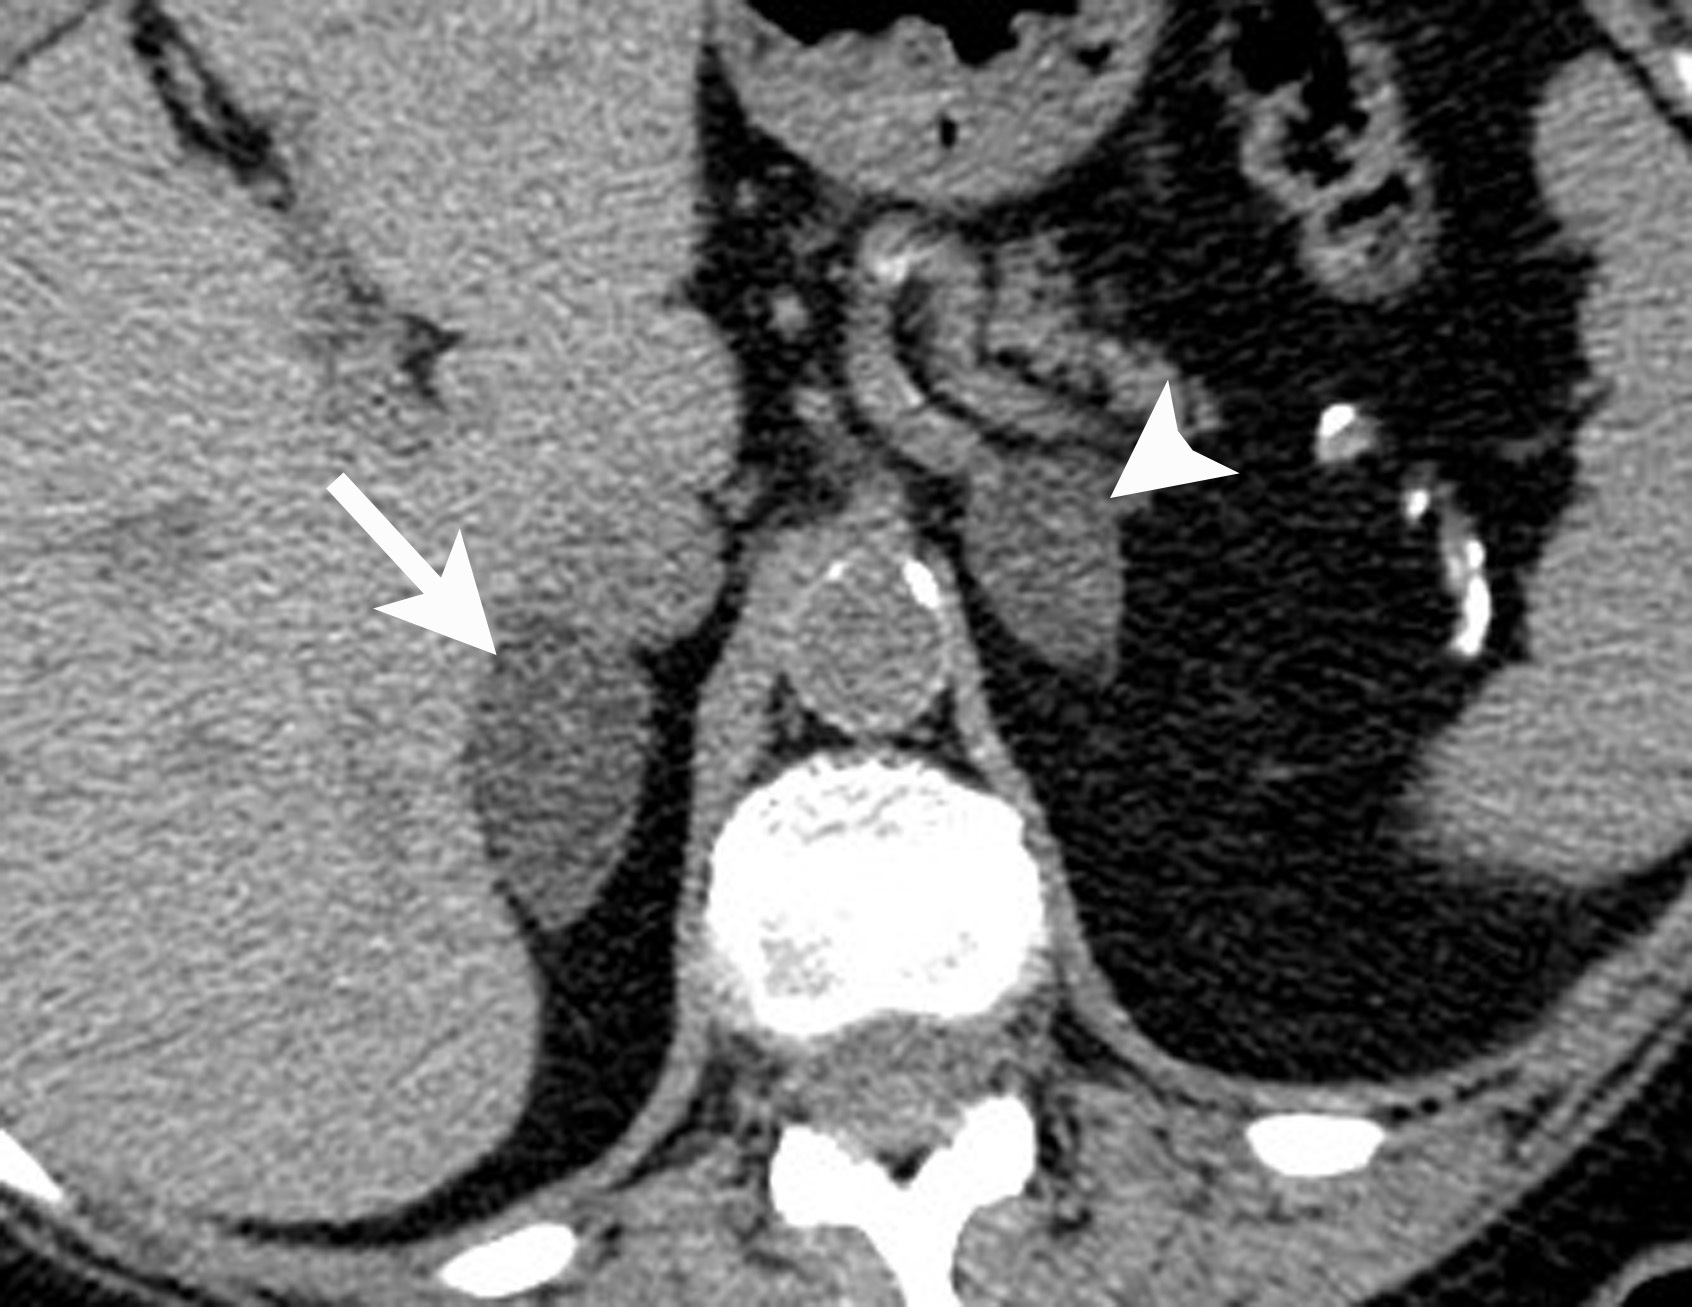
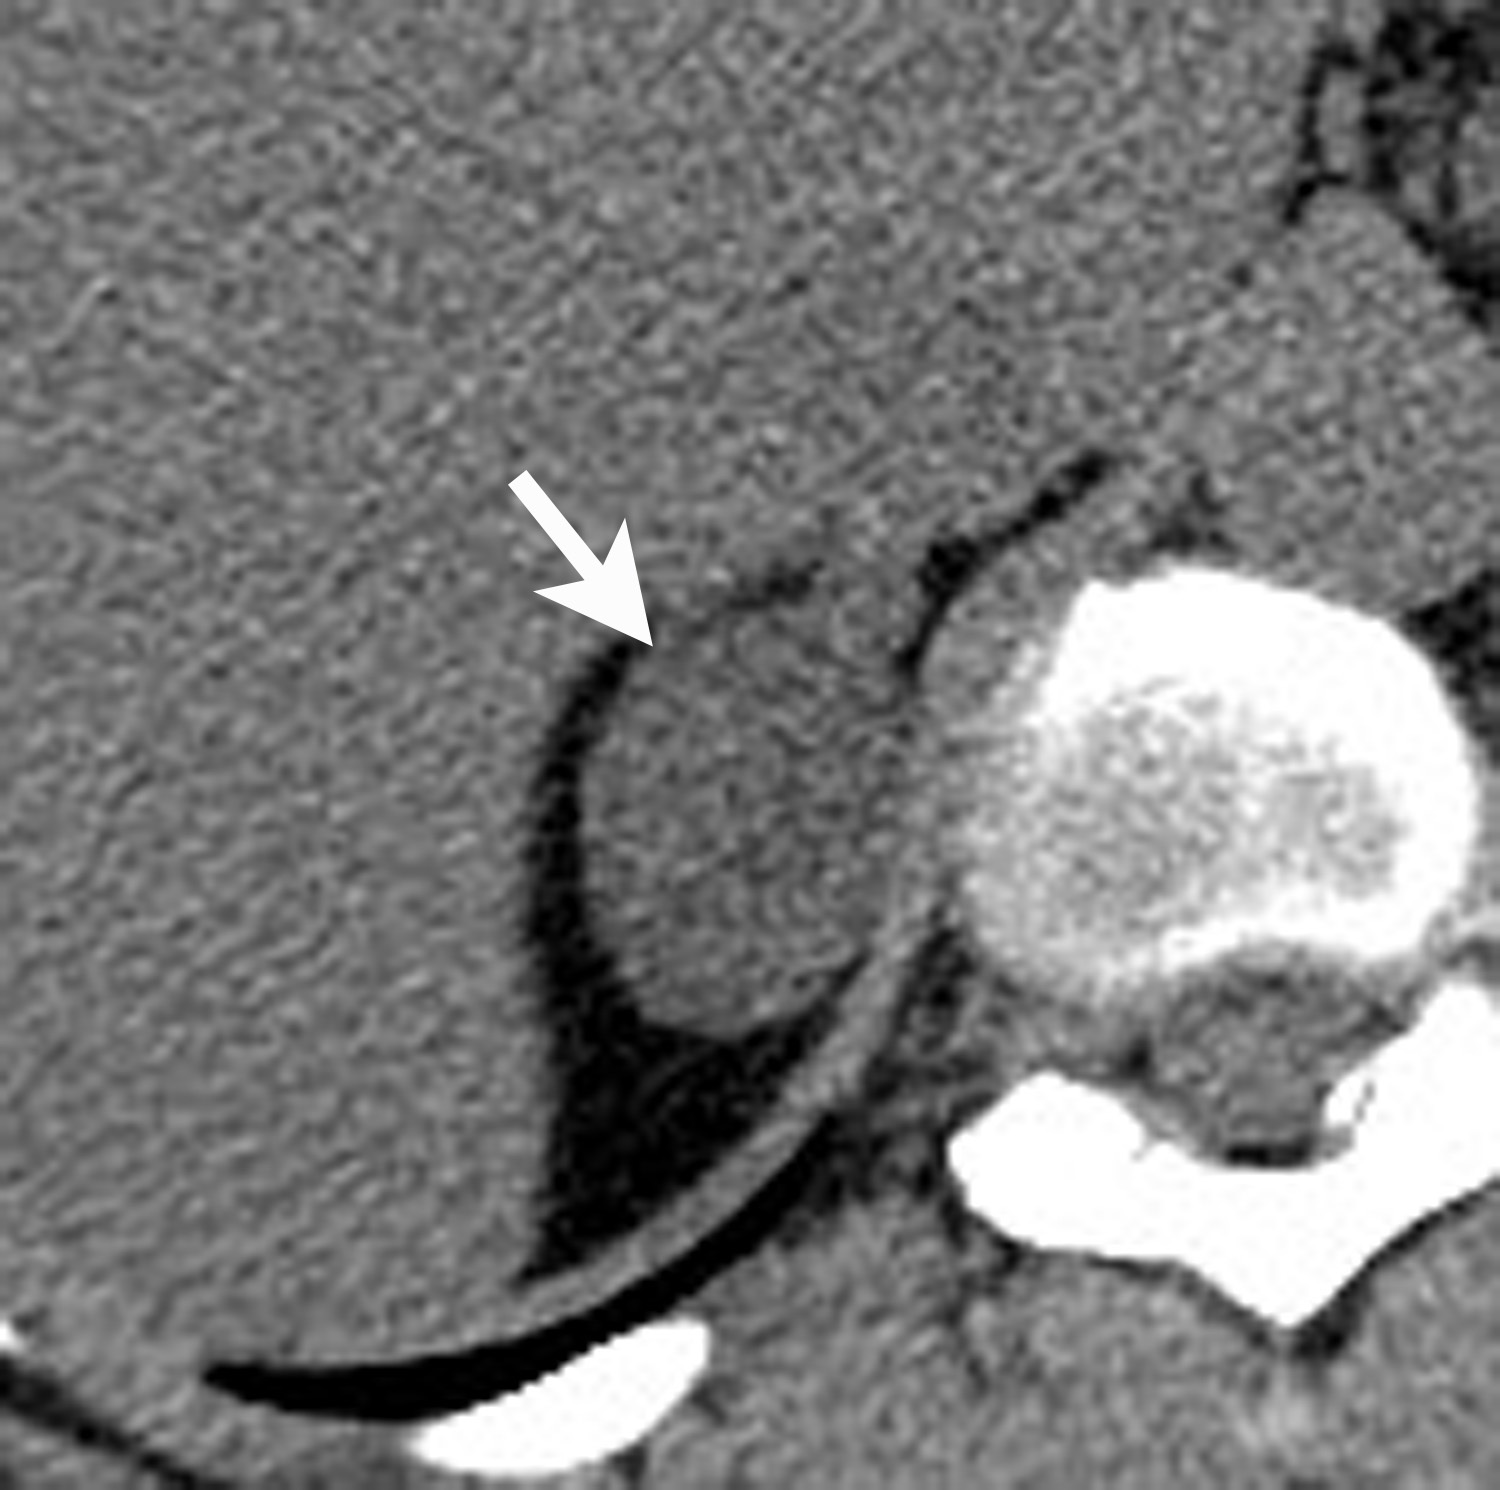
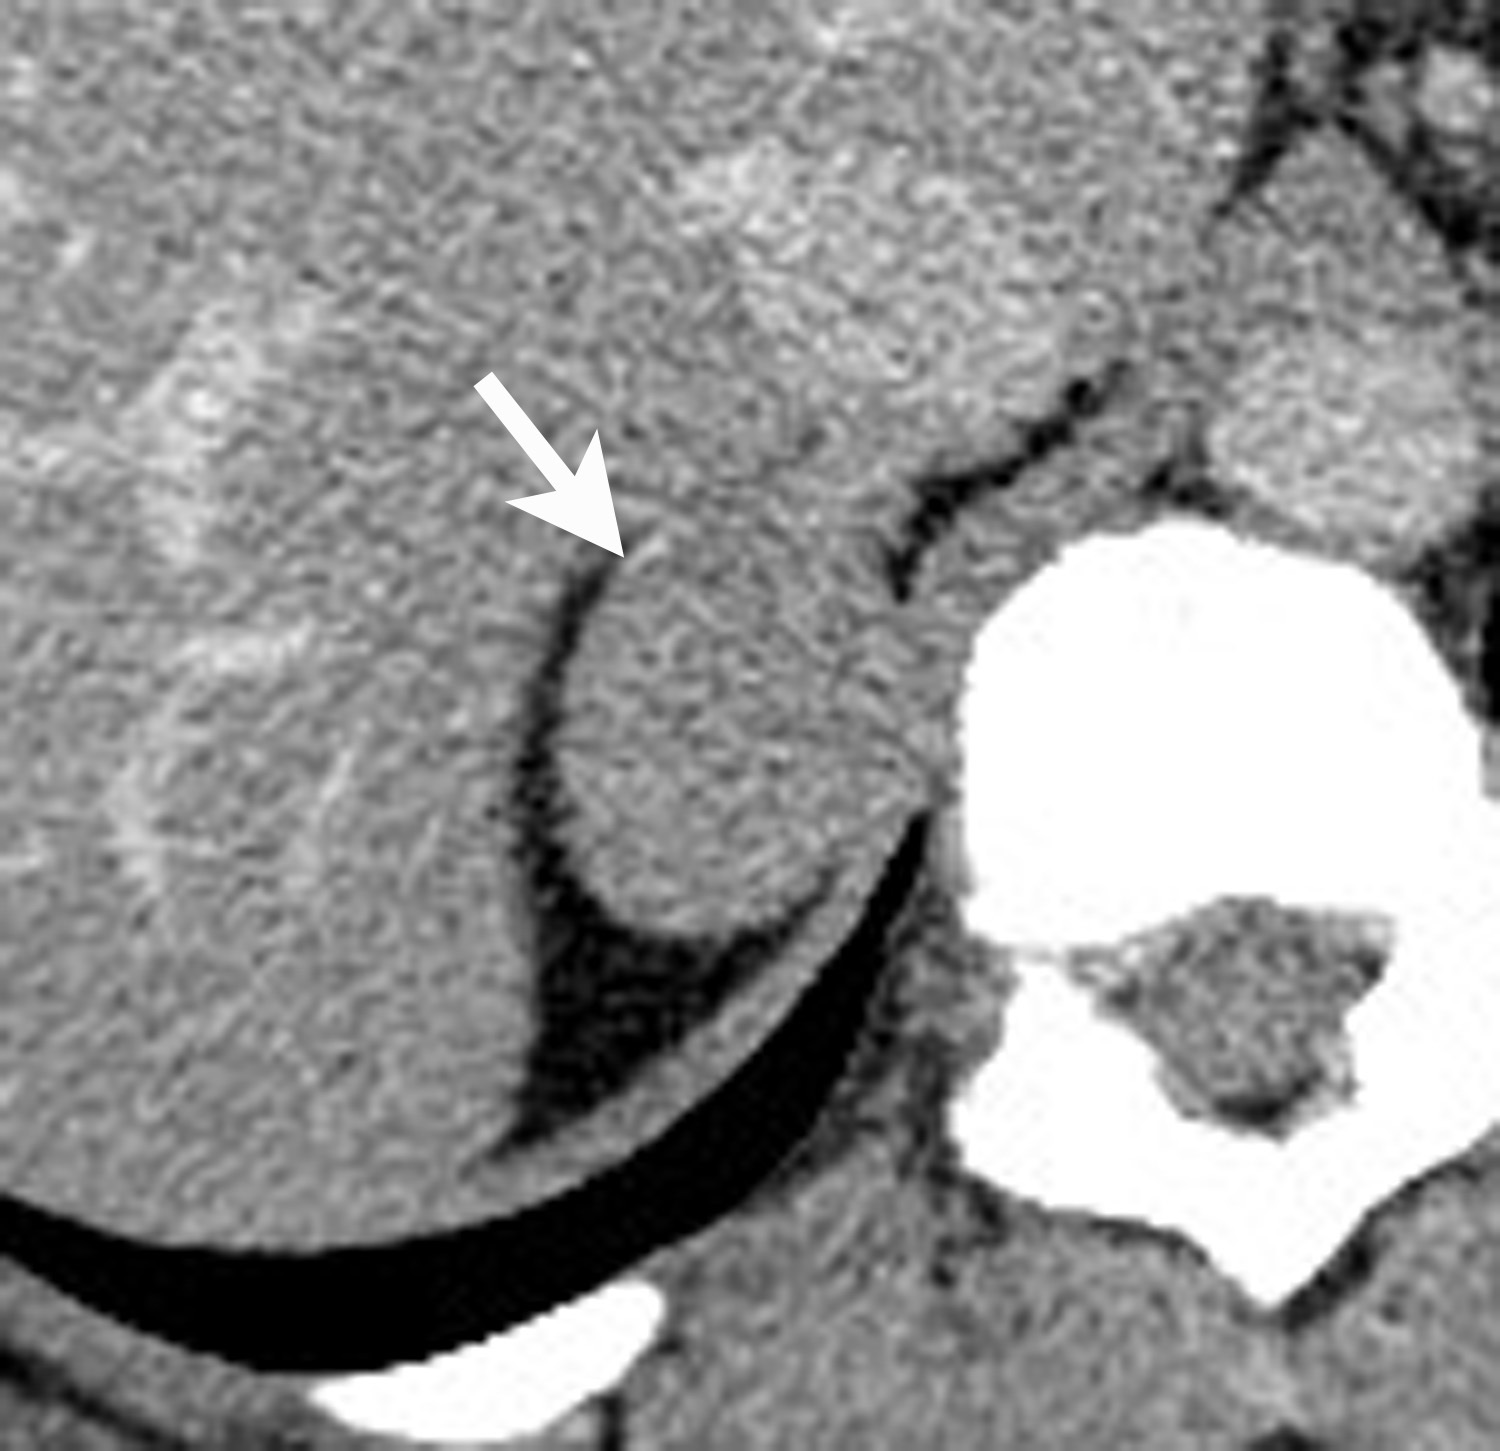
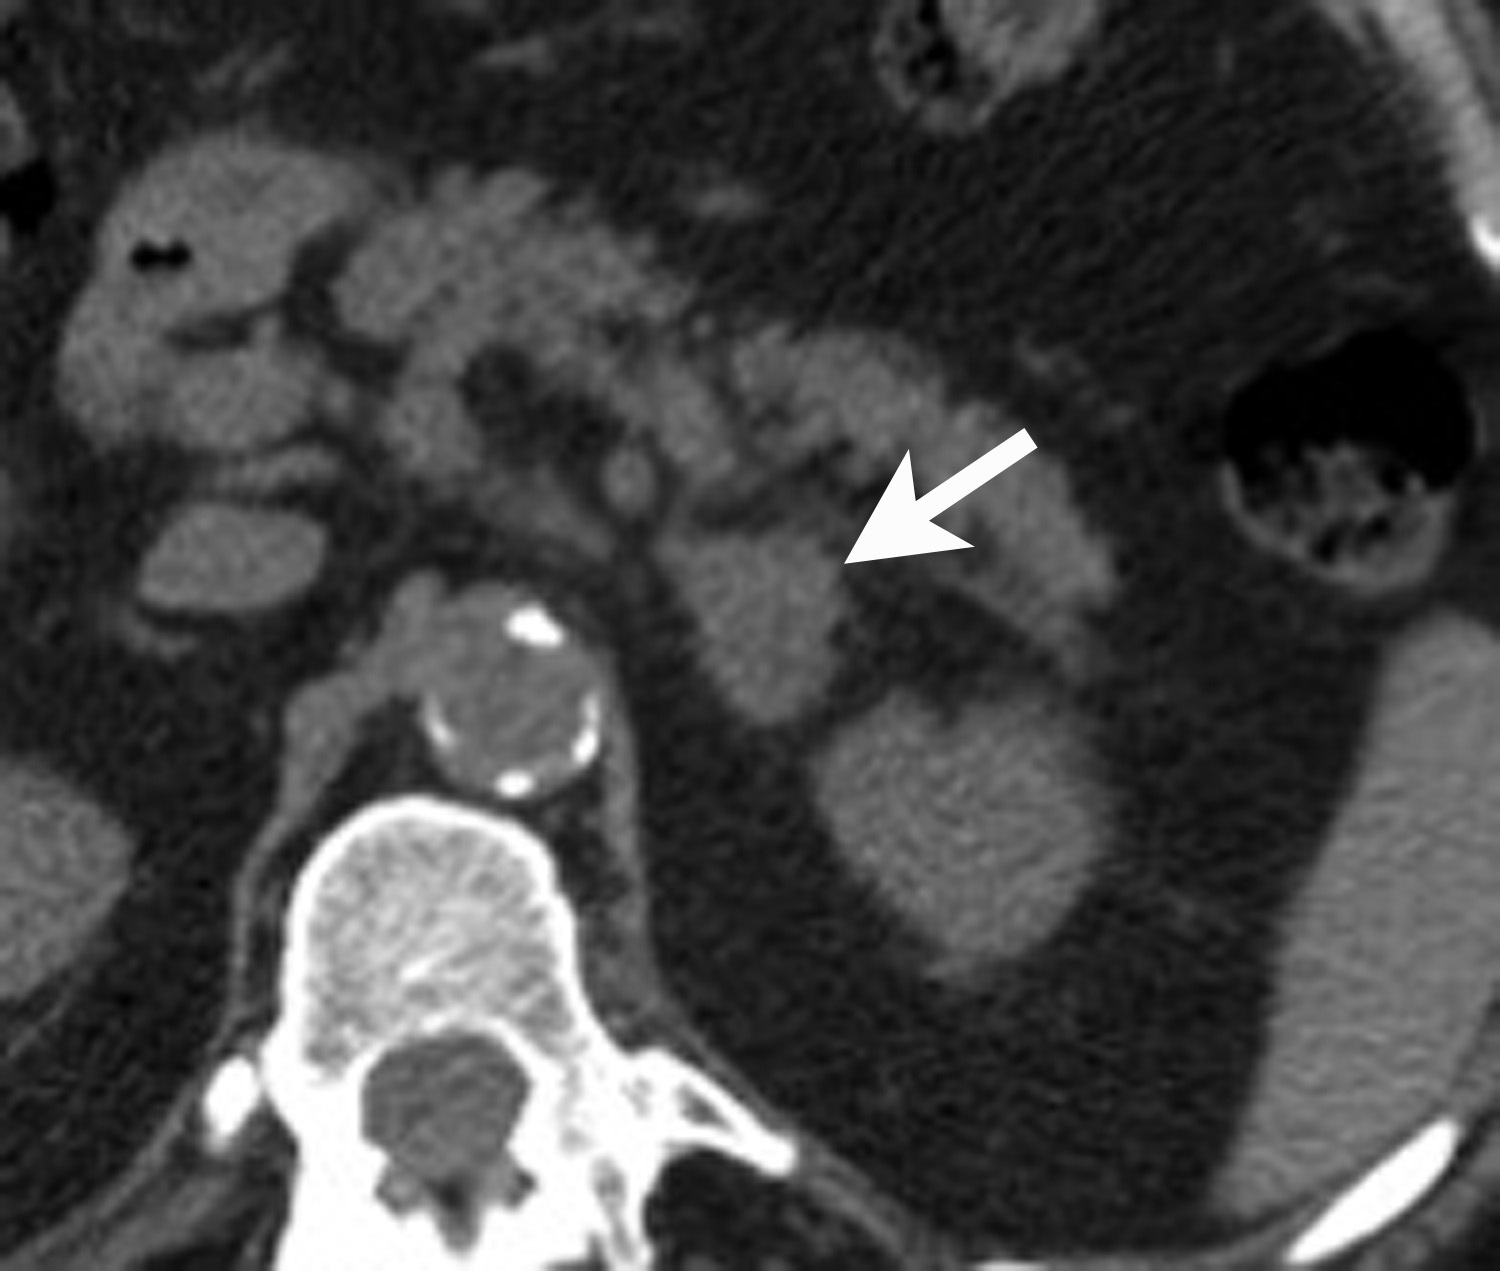
However, if there is clinical concern, or if the lesion has suspicious features such as central necrosis, heterogeneity, and irregular borders, then additional work-up is recommended. This work-up begins with unenhanced CT or chemical shift MR examinations (as described above). If these tests are indeterminate for diagnosis of an adenoma, then adrenal washout calculation can be performed. Adrenal washout calculation is a technique which can diagnose adrenal adenomas but does not depend on identifying intracellular lipid within the adrenal mass. This technique is important because approximately 30% of adenomas have low lipid content and measure >+ 10 HU on non-enhanced CT. These “lipid poor” adenomas can be diagnosed with adrenal CT with wash-out (Figure 5). Adrenal CT with washout calculation differentiates adenomas from nonadenomas because adenomas typically have rapid wash-in and washout of contrast material, whereas nonadenomas usually have relatively slow wash-in and slow washout of contrast material.14-17 Using a 15-minute delay for washout calculation, demonstration of at least 60% absolute percentage washout or 40% relative percentage washout is diagnostic of an adenoma (lipid rich or lipid poor). The formula for absolute percentage washout (APW) is:
APW = [(Enhanced HU) – (15-minute delayed HU)/(Enhanced HU) – (Unenhanced HU)] × 100.
The formula for relative percentage wash-out (RPW) is:
RPW = [(Enhanced HU) – (15-minute delayed HU)/(Enhanced HU)] × 100.
It should be noted that diagnostic imaging with nonenhanced CT, chemical shift MRI, or adrenal CT with washout does not distinguish hyperfunctioning adenomas from non-hyperfunctioning adenomas. This distinction requires correlation with clinical parameters and biochemical testing. Therefore, the ACR proposes the following statement when a benign adenoma is diagnosed based on a diagnostic imaging test: “Findings consistent with a benign adenoma. If there are clinical signs or symptoms of adrenal hyperfunction, biochemical evaluation may be appropriate.”1
Adrenal conundrums
If an adrenal mass can not be characterized and diagnosed using the traditional dedicated adrenal imaging methods described above, one may consider imaging with18FFlourodeoxyglucose PET/CT, or performing an image-guided adrenal biopsy.
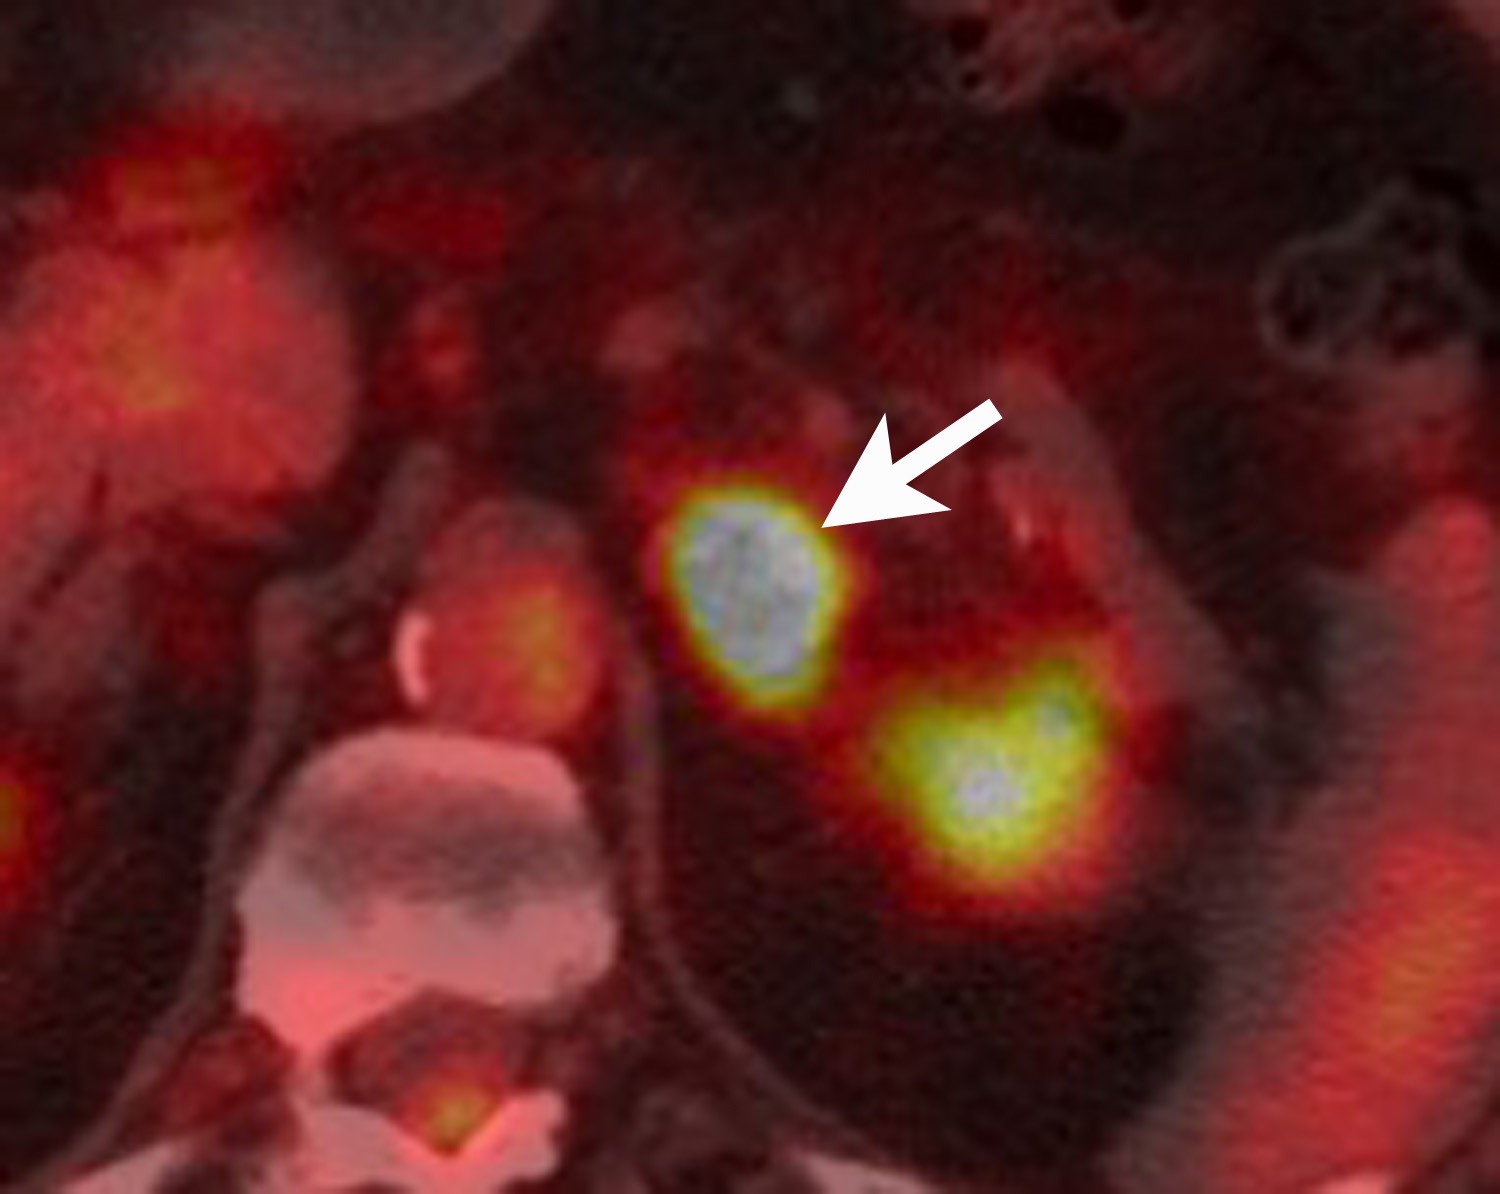
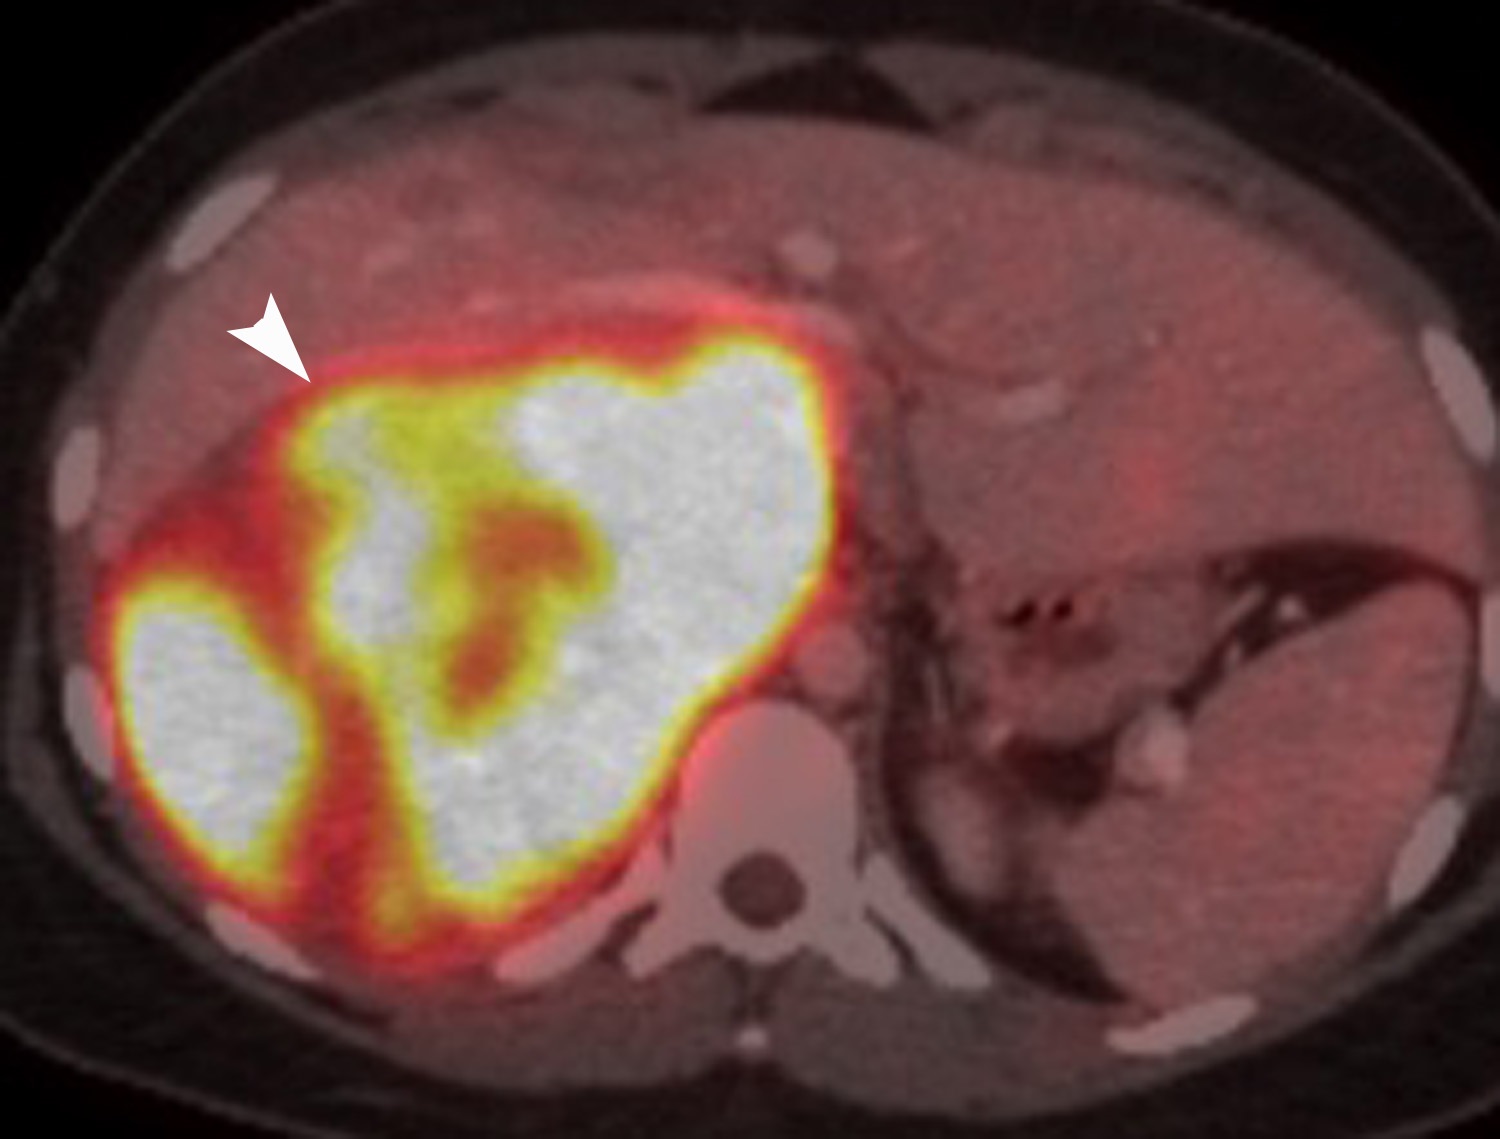
FDG is a radiolabeled D-glucose analog that is preferentially taken up by tissues with increased glucose metabolism. Because malignant tumor cells often have high metabolic rates, FDG-PET can be used for detection of malignant disease. When FDG-PET is co-registered with CT for anatomic data, the combined FDG-PET/CT is a powerful tool for cancer staging and follow-up. Adrenal malignancies such as metastases from extra-adrenal primary cancer, adrenal cortical carcinoma, and pheochromocytomas usually have substantial FDG uptake (Figure 6), whereas benign adrenal masses such as adrenal cysts and adenomas usually have low or negative FDG avidity (Figure 7).18 Thus, an adrenal mass with low or negative FDG uptake is likely to be benign. Note that malignant adrenal lesions may have falsely negative FDG uptake if there is central necrosis, previous chemotherapy treatment, mucinous primary malignancy, or small lesion size.19-21 A small percentage (~5%) of benign adrenal adenomas can have mild FDG avidity. Typically, the degree of uptake is the same or less than the liver.22
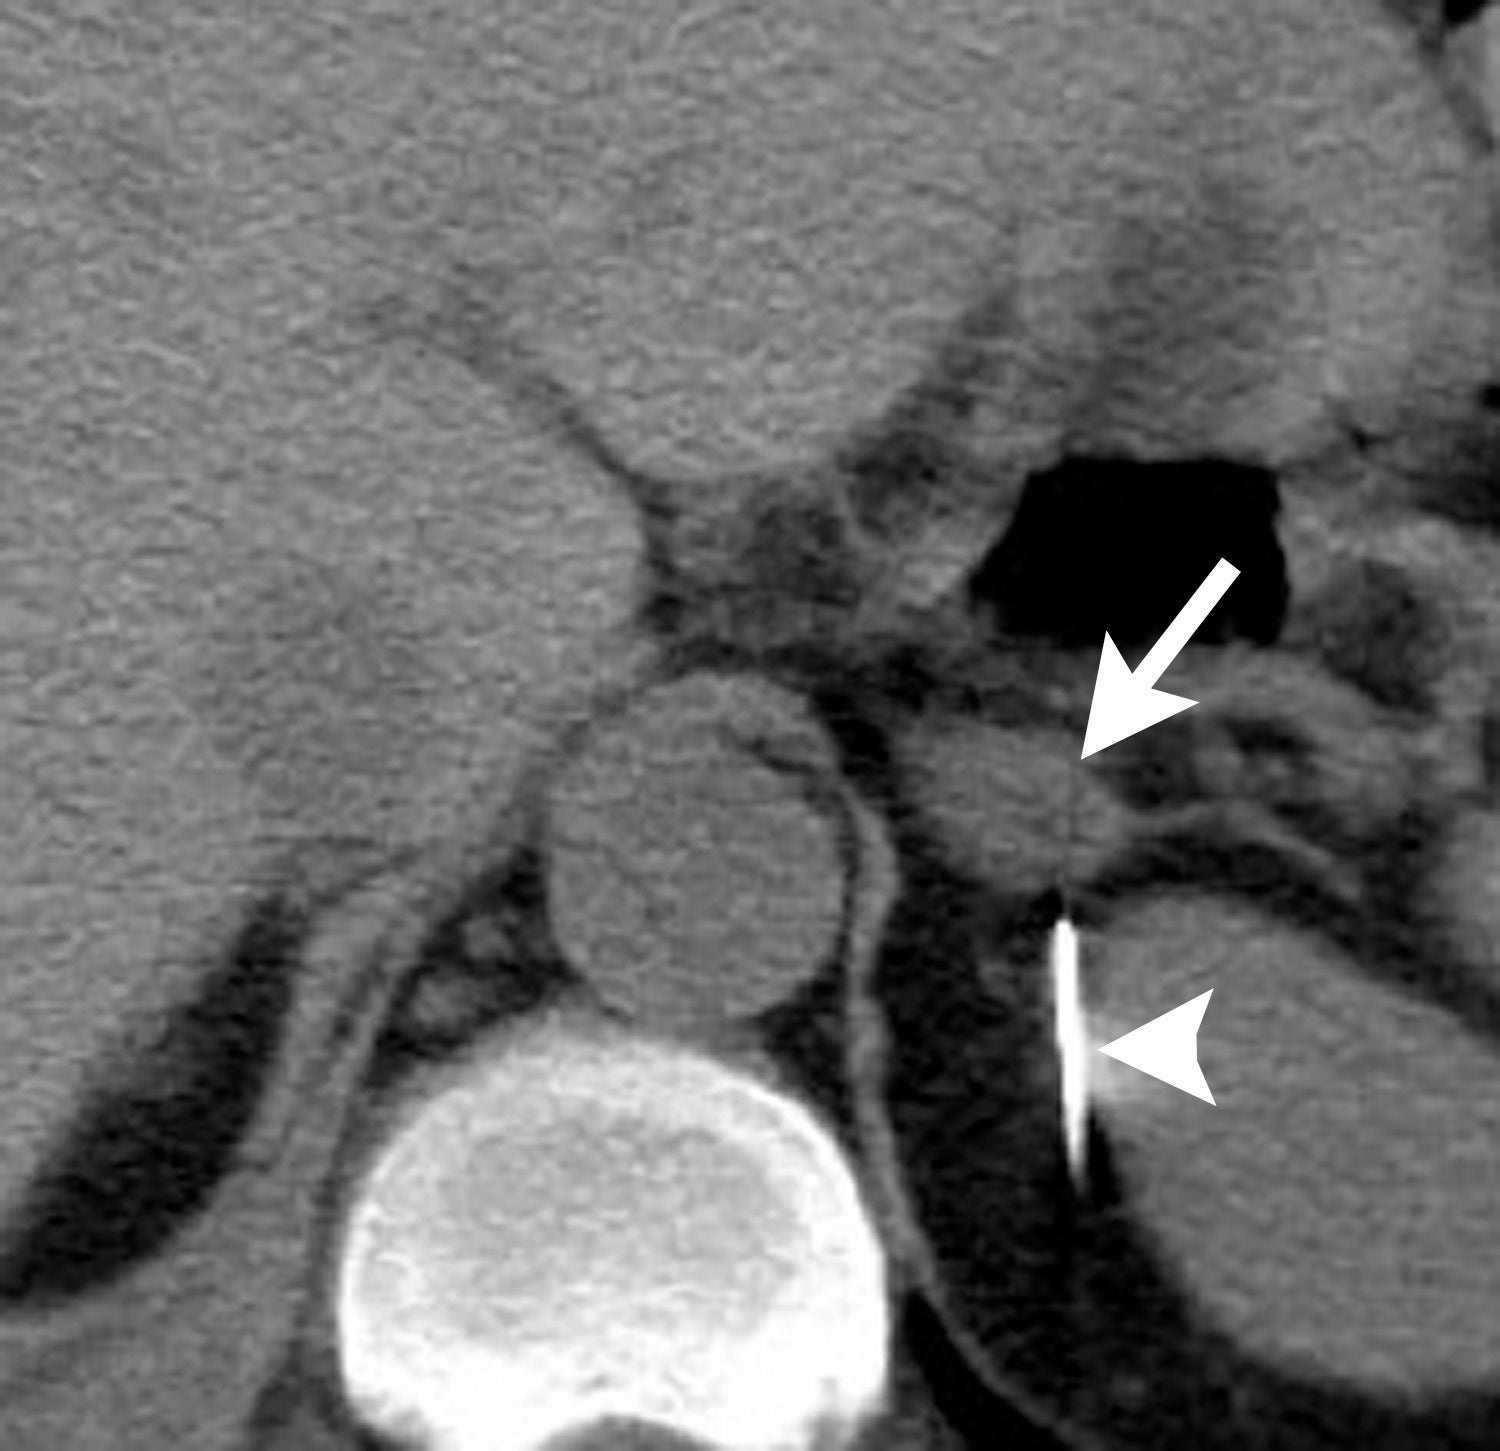
Image-guided adrenal biopsy can be performed safely when non-invasive adrenal imaging tests are inconclusive. The reported estimated complication rate is 3%.5, 10, 23 The most common complications associated with image-guided adrenal biopsy are hemorrhage and pneumothorax. Other risks include infection, pancreatitis, and needle- track seeding. Biopsy of a pheochromocytoma can potentially precipitate of a life-threatening hypertensive crisis if the patient is not under alpha-adrenergic blockade. Biochemical testing can be helpful to exclude the possibility of an adrenal pheochromocytoma. Owing to its deep and retroperitoneal location, CT is the modality of choice for imaging guidance of adrenal lesions. Biopsy of right-sided nodules can be accomplished using a posterior or posterior-lateral approach. A transhepatic approach can also be used for a right adrenal biopsy. A posterior or posterior-lateral approach is preferred for a left adrenal biopsy (Figure 8). Careful avoidance of the pancreas during an adrenal biopsy will mitigate the risk of post-procedure pancreatitis. The accuracy of adrenal biopsy has been reported to be 83-96%.5, 23
Conclusion
Radiologists play an important role in the diagnosis of adrenal diseases. In cases of adrenal Aunt Minnies, the correct diagnosis can be made confidently without additional diagnostic imaging tests. The majority of adrenal incidentalomas will be benign adenomas and these tumors can be differentiated from non-adenomas by following the imaging algorithm outlined in the ACR White Paper on management of incidental findings. Lastly, when diagnostic imaging is inconclusive, resulting in an adrenal conundrum, adrenal biopsy can be performed safely and accurately with CT guidance.
References
- Berland LL, Silverman SG, Gore RM, et al. Managing incidental findings on abdominal CT: white paper of the ACR incidental findings committee. J Am Coll Radiol. 2010;7(10):754-773.
- Mayo-Smith WW, Song JH, Boland GL, et al. Management of adrenal masses: A white paper of the ACR incidental findings committee. J Am Coll Radiol. 2017;14(8):1038-1044.
- Applegate KE, Neuhauser DV: Whose Aunt Minnie? Radiology. 1999;211(1):292.
- Vick CW, Zeman RK, Mannes E, et al. Adrenal myelolipoma: CT and ultrasound findings. Urol Radiol. 1984; 6(1):7-13.
- Boland GW, Blake MA, Hahn PF, et al. Incidental adrenal lesions: principles, techniques, and algorithms for imaging characterization. Radiology. 2008; 249(3):756-775.
- Cyran KM, Kenney PJ, Memel DS, et al. Adrenal myelolipoma. AJR Am J Roentgenol. 1996; 166(2):395-400.
- Rao P, Kenney PJ, Wagner BJ, et al. Imaging and pathologic features of myelolipoma. Radiographics.1997; 17(6):1373-1385.
- Dong A, Cui Y, Wang Y, et al. (18)F-FDG PET/CT of adrenal lesions. AJR Am J Roentgenol. 2014; 203(2):245-252.
- Ricci Z, Chernyak V, Hsu K, et al. Adrenal cysts: natural history by long-term imaging follow-up. AJR Am J Roentgenol. 2013; 201(5):1009-1016.
- Young WF, Jr.. Clinical practice. The incidentally discovered adrenal mass. N Engl J Med. 2007; 356(6):601-610.
- Boland GW, Lee MJ, Gazelle GS, et al. Characterization of adrenal masses using unenhanced CT: an analysis of the CT literature. AJR Am J Roentgenol. 1998; 171(1):201-204.
- Korobkin M, Giordano TJ, Brodeur FJ, et al. Adrenal adenomas: relationship between histologic lipid and CT and MR findings. Radiology. 1996; 200(3):743-747.
- Fujiyoshi F, Nakajo M, Fukukura Y, et al. Characterization of adrenal tumors by chemical shift fast low-angle shot MR imaging: comparison of four methods of quantitative evaluation. AJR Am J Roentgenol. 2003; 180(6):1649-1657.
- Caoili EM, Korobkin M, Francis IR, et al. Delayed enhanced CT of lipid-poor adrenal adenomas. AJR Am J Roentgenol. 2000; 175(5):1411-1415.
- Rodacki K, Ramalho M, Dale BM, et al. Combined chemical shift imaging with early dynamic serial gadolinium-enhanced MRI in the characterization of adrenal lesions. AJR Am J Roentgenol. 2014; 203(1):99-106.
- Sangwaiya MJ, Boland GW, Cronin CG, et al. Incidental adrenal lesions: accuracy of characterization with contrast-enhanced washout multidetector CT--10-minute delayed imaging protocol revisited in a large patient cohort. Radiology. 2010; 256(2):504-510.
- Foti G, Faccioli N, Manfredi R, et al. Evaluation of relative wash-in ratio of adrenal lesions at early biphasic CT. AJR Am J Roentgenol. 2010; 194(6):1484-1491.
- Metser U, Miller E, Lerman H, et al. 18F-FDG PET/CT in the evaluation of adrenal masses. J Nucl Med. 2006; 47(1):32-37.
- Park SY, Park BK, Kim CK. The value of adding (18)F-FDG PET/CT to adrenal protocol CT for characterizing adrenal metastasis (>/= 10 mm) in oncologic patients. AJR Am J Roentgenol. 2014; 202(2):W153-60.
- Vikram R, Yeung HD, Macapinlac HA, et al. Utility of PET/CT in differentiating benign from malignant adrenal nodules in patients with cancer. AJR Am J Roentgenol. 2008; 191(5):1545-1551.
- Boland GW, Blake MA, Holalkere NS, et al. PET/CT for the characterization of adrenal masses in patients with cancer: qualitative versus quantitative accuracy in 150 consecutive patients. AJR Am J Roentgenol. 2009; 192(4):956-962.
- Boland GW, Dwamena BA, Jagtiani Sangwaiya M, et al. Characterization of adrenal masses by using FDG PET: a systematic review and meta-analysis of diagnostic test performance. Radiology. 2011; 259(1):117-126.
- Mayo-Smith WW, Boland GW, Noto RB, et al. Radiographics. 2001; 21(4):995-1012.
Citation
LM H. Adrenal imaging: A three-category approach to managing incidentalomas. Appl Radiol. 2018;(10):8-13.
October 16, 2018