MDCT: Impact of new technologies on oncologic imaging—practical considerations
Dr. Le, Dr. Bhosale, Dr. Skalruk, Dr. Ng, and Dr. Tamm are from the Department of Diagnostic Radiology, The University of Texas MD Anderson Cancer Center, Houston, TX.
Computed tomography (CT) imaging has evolved markedly since its inception in the 1970s. Such advancements as spiral CT, followed by multislice/multidector CT, created new applications because of increasing speed and thinner-section imaging. The most recent advances in CT—dual-energy imaging, perfusion imaging, iterative reconstruction, and better postprocessing techniques—also promise new opportunities for imaging. This review article will provide an overview of the potential impact of these new technologies on oncologic imaging.
Dual energy
Dual-energy CT (DECT) originated in the 1970s, but its routine clinical implementation was not practical until more recent developments were made in computer software and hardware. The principle of DECT is that by utilizing 2 energy settings, materials can be differentiated based on their attenuation characteristics.1 Attenuation depends on the spectrum of energy used and the material of the object itself. A material’s density (Hounsfield Unit, HU) varies with tube energy secondary to a basic linear combination of the photoelectric effect and Compton scattering for a given material.
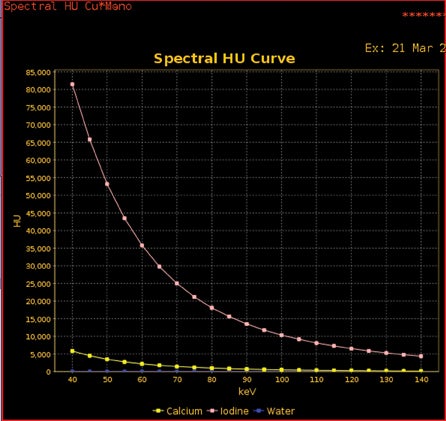
Tube energy is commonly referred to in terms of kVp and keV. The much more common polychromatic energy beam of conventional multidetector CT (MDCT) scanners is kVp (the maximum energy in a polychromatic spectra; ie, 140 kVp, meaning a spread of photon energies, with 140 being the highest), and keV represents the monochromatic beams (by definition, a monochromatic beam has only a single energy; ie, 70 keV represents the single energy present within that beam). Therefore, any material’s HU can be plotted on a curve as a function of kVp or keV (Figure 1). Furthermore, any material density’s curve can be represented by the combination of 2 other materials’ known curves. These other materials are known as basis materials. Two of the most commonly used basis materials are iodine and water, since they are sufficiently different in atomic number to represent the range of densities commonly used in medical imaging.
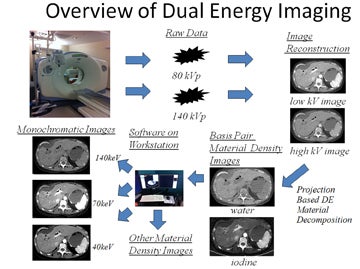
DECT imaging typically obtains the density of any given voxel at energies of 80 kVp and 140 kVp from a single or dual-source CT scanner. How this information is utilized depends on the manufacturer. Our experience is with the single source General Electric (Milwaukee, WI) HD750 CT scanner. With this scanner, information is then used to create basis pair material-density images (ie, images consisting of water without iodine or iodine without water). In addition, using software, a variety of other material density images can be created, such as calcium without iodine, or iodine without calcium, the latter useful in creating angiographic images without calcified plaque.
DECT software can also be used to mathematically create monochromatic energy images (Figure 2). These images represent voxels as if they had been imaged with a beam of only a single energy; ie, 70 keV. This eliminates the problem of beam hardening, a phenomenon where the weaker energies of a polychromatic beam are “filtered out.” As a polychromatic beam penetrates deeper into an object, weaker energy photons are increasingly absorbed, progressively “filtering” the beam to leave behind higher energy photons. This may lead to inconsistent density measurements (HUs) for a given material depending on where within an object a material is located. In contrast, monochromatic energy images should provide more consistent density measurements across an image and potentially minimize shifts in density between pre- and postcontrast scans. Additional benefits of DECT include the ability of such software to view monochromatic energy images anywhere across the range from 40 to 140 keV. Low keV images enhance the presence of iodine, thereby improving contrast.
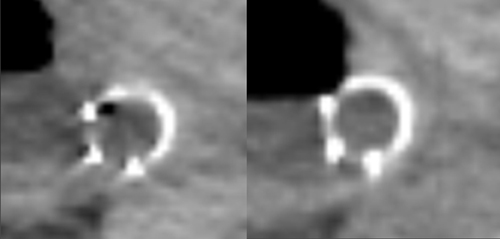
DECT has been found to be useful in several applications. These include eliminating calcium-containing plaques from arteriograms, minimizing metal artifacts, eliminating barium contrast from the GI tract to enhance detection of bowel lesions, enhancing or minimizing the conspicuity of iodine (creating virtual noncontrast images), differentiating materials containing a variety of elements (the urate crystals of gout versus the calcium pyrophosphate crystals of pseudogout and distinguishing the various types of ureteral calculi by chemical composition (Figure 3).2-4 Simultaneously, sophisticated workstation software provides an understanding of the meaning of this burgeoning data through the use of such tools as scatter plots, density versus keV curves, contrast-to-noise curves, and virtual atomic number graphs. A full discussion of such tools is beyond the scope of this paper; the effective use of such tools is rapidly evolving (See Figure 4 for an overview of dual-energy imaging).
Oncologic applications of DECT are evolving in a variety of areas as well. We will describe potential applications for the kidney, liver, and pancreas.
Kidney
Multidetector CT has been the primary imaging tool at many institutions for the workup of renal masses. A typical MDCT exam includes noncontrast, postcontrast, nephrographic, and delayed-phase images, including thin-section image sets, to characterize renal masses. Thin-section images can be postprocessed to elucidate vascular anatomy and the relationship of tumor to vessels. Such information has helped to answer a variety of questions, such as the extent of tumor thrombus that may be present within the renal veins and inferior vena cava and for surgical planning.
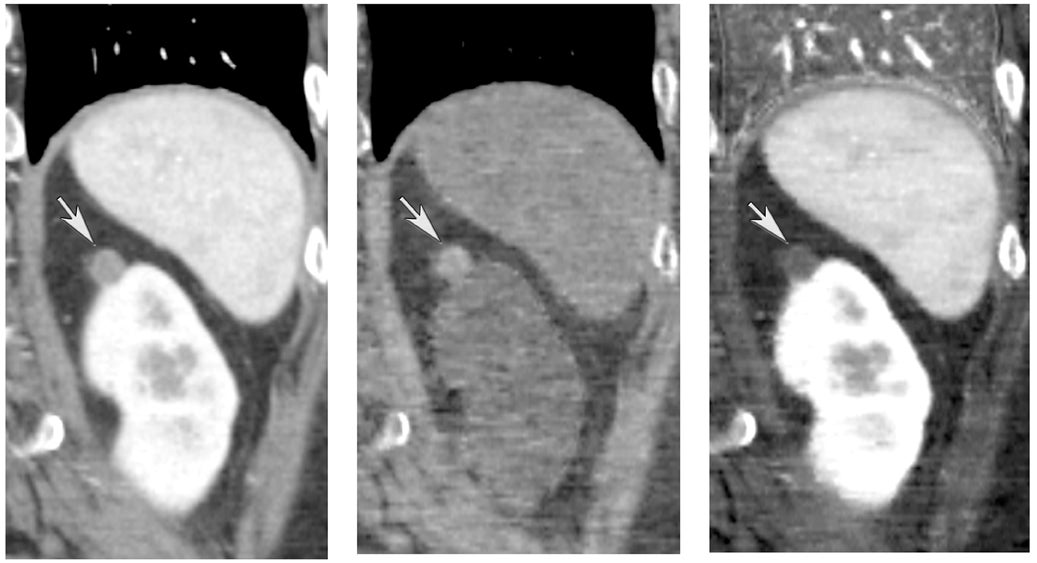
One challenge in renal imaging has been evaluating cystic lesions to determine whether they demonstrate enhancement with intravenous contrast, an indicator of cystic neoplasms. The data provided by a DECT single acquisition can be used postscan to create a wide range of monochromatic images and an essentially unlimited number of types of material density images, limited only by the capabilities of the workstation processing that data. Low monochromatic energy images may also help with determining the presence of subtle enhancement, particularly in such problematic lesions as hemorrhagic or proteinaceous cysts. Water (minus iodine) material density images permit creation of virtual noncontrast images, thereby potentially decreasing radiation dose by avoiding a separate precontrast acquisition. Graser et al5 found that a virtual noncontrast phase provided by DECT yields a reasonable approximation to a conventional true noncontrast enhanced image, with an additional radiation dose reduction of 35%, since only 2 phases are needed on the DECT. The converse—iodine images (minus water)— also enhance the conspicuity of iodine and, therefore, the detection of enhancement. We have found these types of material density images in conjunction with low monochromatic energy images to be useful and to increase our confidence when assessing enhancement, such as in the case of problematic hemorrhagic or proteinaceous cysts (Figure 5). We would, however, caution that water and iodine basis pair material-density images represent the amount of water and iodine necessary to mimic the behavior of the material in a given voxel at different energies. They do not represent the actual amount of iodine or water present within a given voxel. The same applies for other types of material-density images.
Liver
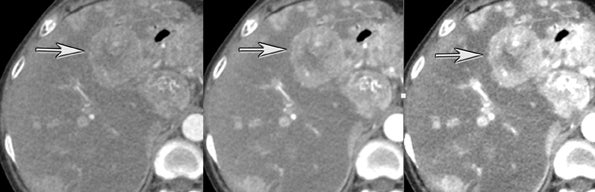
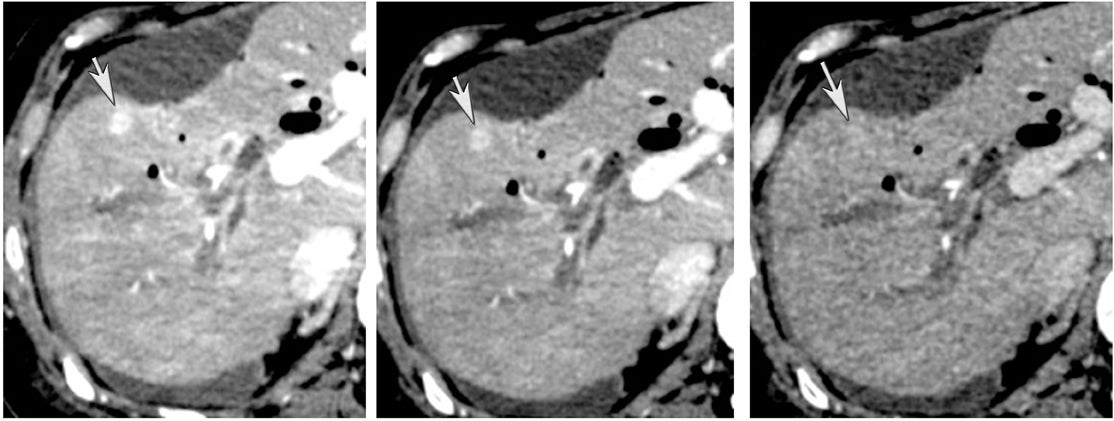
The authors typically utilize DECT during the late arterial phase of a multiphasic imaging protocol. This is particularly useful for evaluating pathology manifesting as commonly hyperdense on this phase of imaging. It has been shown that hyperdense liver lesions, such as hepatocellular carcinoma and hypervascular metastasis, are better visualized on DECT.6 Altenbernd et al6 found that low-energy images of DECT are more sensitive in detecting hypervascular liver lesions (Figure 6). This is probably because a lower KvP or keV enhances the conspicuity of iodininated contrast.7 Thicker-section maximum intensity projection (MIP) images, in our experience, may further increase conspicuity. The tradeoff of a lower keV is a decrease in the subjective image quality. DECT, as noted earlier, allows for creation of angiographic images (higher monochromatic energy) that can be utilized to assess, for example, hepatic vascular anatomy for surgical planning. High- and low-energy images can be created from the same imaging acquisition, eliminating the need to choose between high contrast and low noise at scanning.
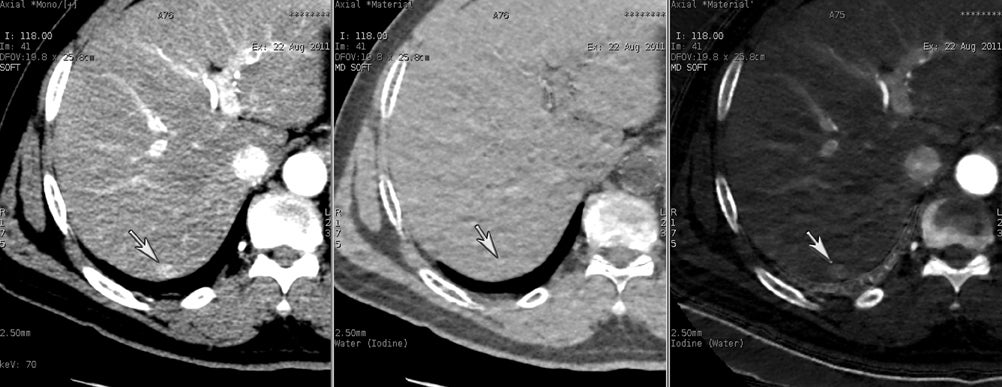
Another issue of liver imaging is the frequently encountered small, incidental, nonspecific lesion that statistically most likely represents a benign lesion, such as a cyst.8 In an oncologic patient, any improvement in the ability to differentiate such cysts from small metastatic lesions would greatly aid treatment planning. DECT may help improve such lesion characterization by making subtle enhancement more conspicuous with low-energy monochromatic images and iodine (minus water) material-density images. Similar to renal cysts, hepatic cysts will appear relatively hypointense compared with adjacent liver parenchyma on water material-density images and display a lack of iodine enhancement on iodine material density images. Metastatic disease should appear isodense relative to the adjacent liver parenchyma on the water material-density images and demonstrate iodine uptake on the iodine material-density images (Figure 7).1
Pancreas
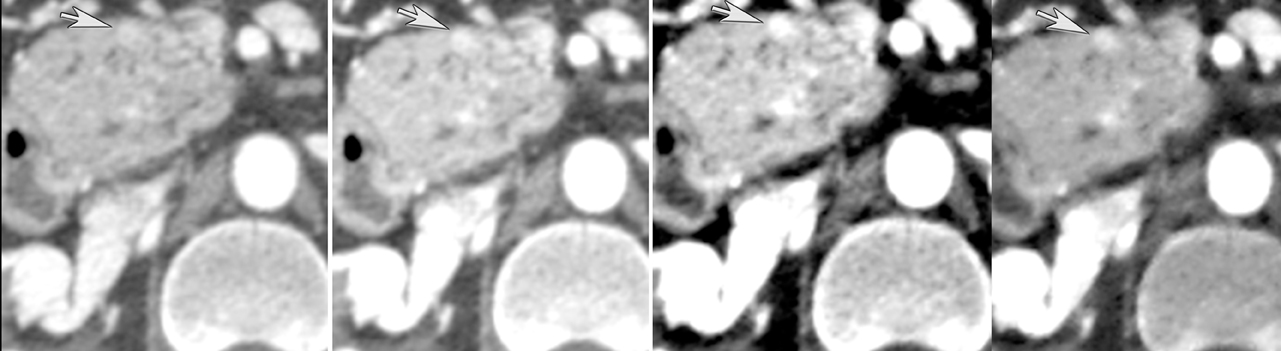
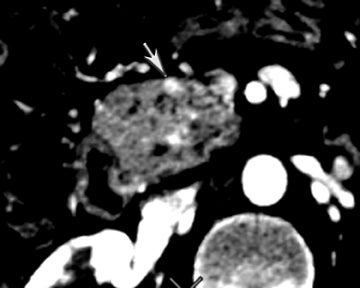
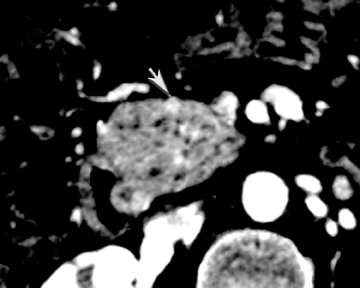
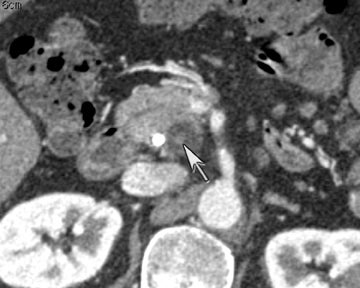
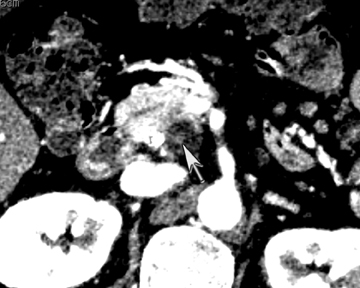
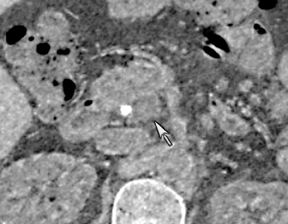
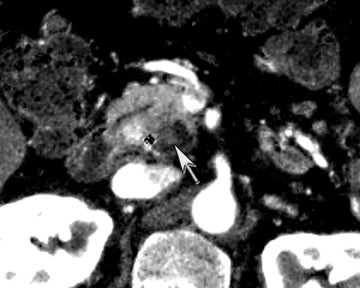
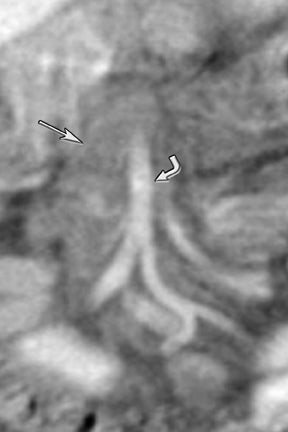
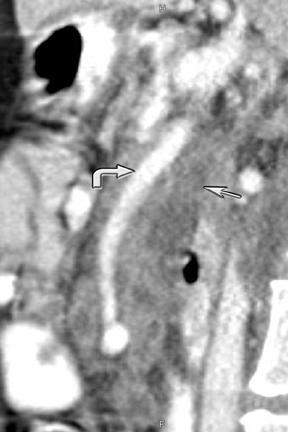
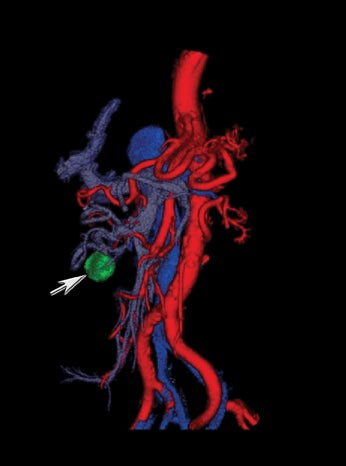
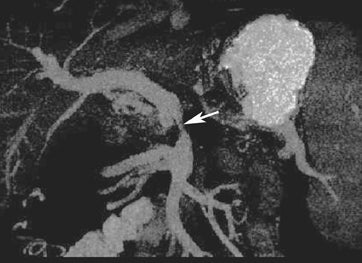
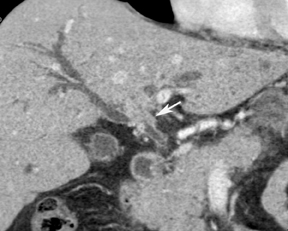
DECT has potential uses across the range of solid and cystic lesions that may manifest within the pancreas. A recent study analyzed 35 patients with 39 proven pancreatic neuroendocrine lesions who went to surgery. Twenty-three were imaged by DECT (dual phase), and 11 were imaged by single-energy (dual phase) CT. DECT showed a sensitivity of 96% for lesion detection with the use of monochromatic images and iodine material-density images. In contrast, single energy had a detection rate of 69% (Figure 8).9
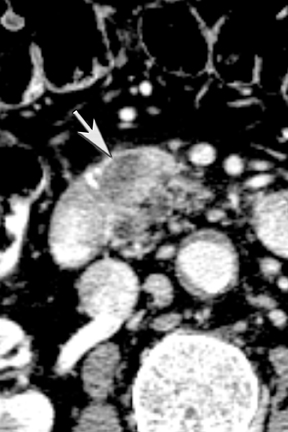
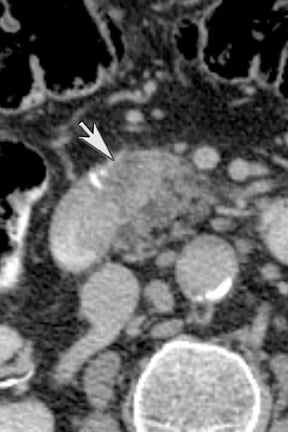
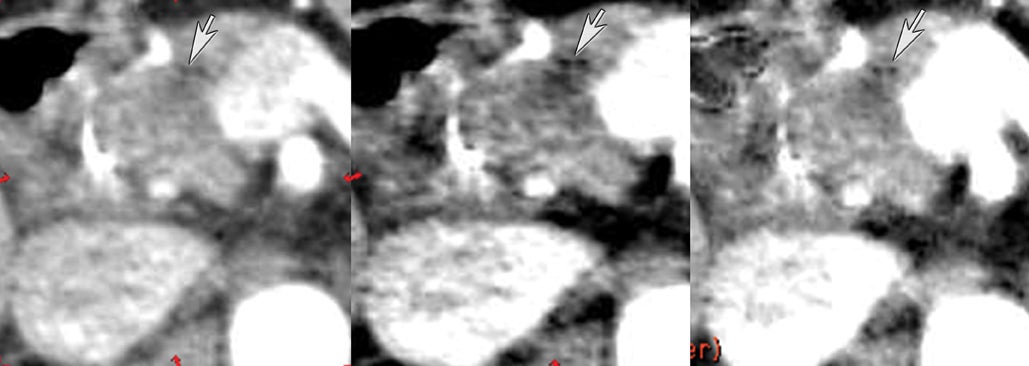
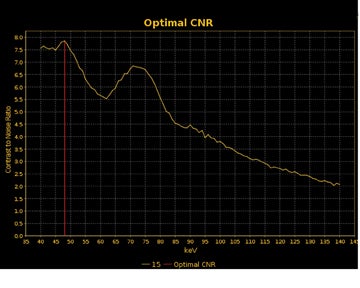
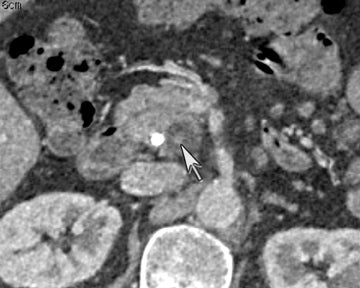
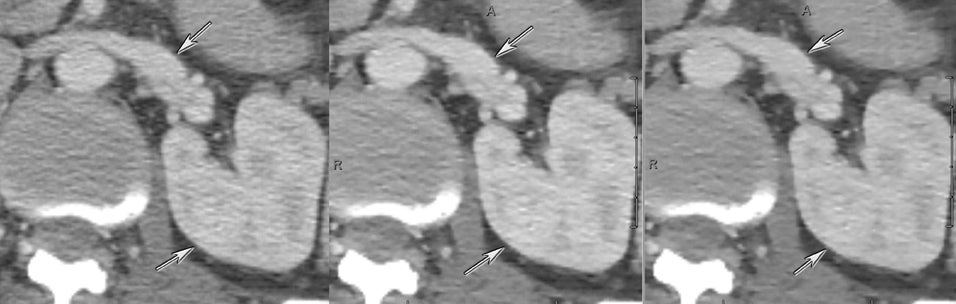
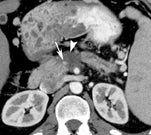
DECT may also provide better conspicuity for typically hypodense pancreatic ductal adenocarcinomas through the use of monochromatic images and iodine material density images. Pancreatic adenocarcinomas are typically hypodense on the arterial or pancreatic parenchymal phase and appear less conspicuous on the portal phase where they can be isodense (Figure 9).10 Macari et al11 showed that with lower, 80 kVp vs. 120 kVp data generated from DECT, hypodense and isodense pancreatic tumors are more conspicuous when compared with higher peak kilovoltage images (Figure 10). While 80 kVp images typically are possible only in patients with small body habitus for single-energy CT scanners, DECT makes the entire range of energies available from only a single-imaging acquisition. The use of contrast-to-noise curves can help the radiologist identify energies at which a tumor may be most conspicuous (Figure 11).
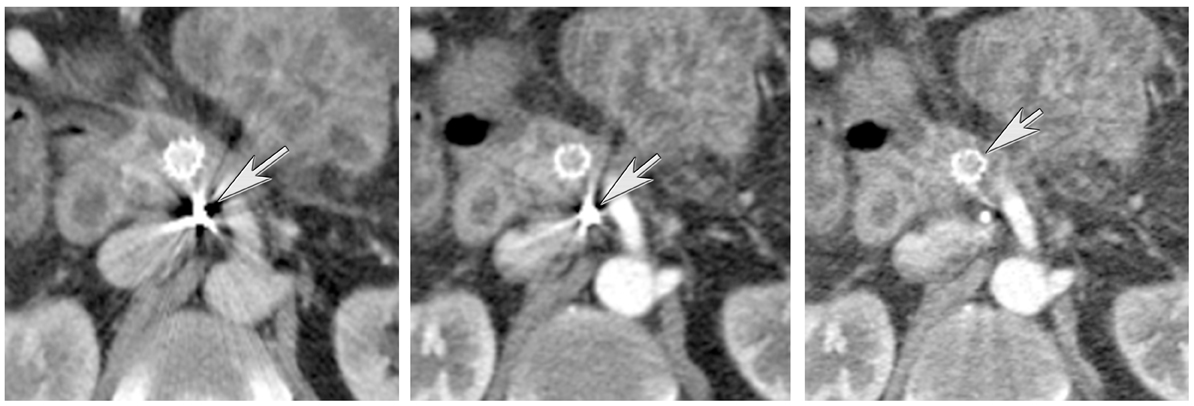
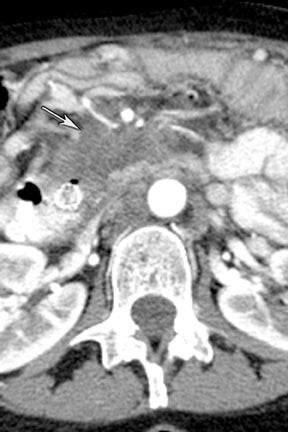
DECT can also be used to reduce metal artifacts, such as those that result from imaging adjacent to certain surgical clips or stents, to better visualize extent of tumor or potentially subtle recurrence, employing such special techniques as the metal artifact reduction sequence (MARS, General Electric, Milwaukee, WI) (Figure 12).
Finally, pancreatic cystic lesions are problematic because of their high incidence, and high likelihood of being benign. Identifying potentially solid components can be helpful in targeting these lesions for endoscopic ultrasound evaluation. DECT’s ability to potentially improve detection of subtle enhancement in a cystic lesion will be useful in these circumstances (Figure 13).
Potential future directions
DECT is a relatively new technological development. It has been shown to have potential utility in a wide variety of diseases. Recent advances by manufacturers are decreasing the impact of such techniques on radiation dose. Yu et al12 found that DECT used in adult imaging can produce a set of images for routine diagnostic interpretation that are of similar or improved quality compared to conventional single-energy 120-kVp scans with the same radiation exposure. Future developments for DECT may include dose reduction by automated tube current modulation and user-modifiable iterative reconstruction. More accurate, or quantitative/semi-quantitative, approaches to identifying enhancement with iodinated contrast would have significant advantages over conventional CT density numbers (HU) derived by polychromatic beam imaging, which are not absolute and can vary by scanner, reconstruction technique, patient size, and the x-ray tube potential.13 Material-density images give the opportunity to potentially quantitatively or semi-quantitatively determine the amount of iodine and may, therefore, be helpful in providing additional characteristics for identifying tumor treatment response.
DECT can detect and differentiate between iodine contrast and calcium based on their HU curves. Tran et al14 has proposed that the accuracy depends on the CT density of tissue and is limited when CT attenuation is low. Future improvements in this area are expected. The possibility of even more advanced techniques, such as photon counting and better discernment of even lower energies, may improve characterization of materials within tissues and thereby offer additional benefits for oncologic imaging.
Perfusion imaging
Angiogenesis is a complex process involving a variety of cells and pro- and antiangiogenic factors. Vascular endothelial growth factor (VEGF) and fibroblast growth factor (FGF) are just 2 well-known proangiogenic cytokines produced by tumors. In contrast to normal physiologic angiogenesis, malignant tumor angiogenesis is often a disordered and chaotic process, typically creating fragile vessels, arteriovenous shunting, with high vessel permeability, unstable blood flow, and heterogeneity of vascular density.15 Tumor progression is often associated with neovascularization via angiogenesis.16
Both normal physiologic processes and tumor growth and survival rely on angiogenesis CT perfusion imaging, otherwise known as functional CT or cine CT, which provides a noninvasive method to evaluate the variables that provide insight into angiogenesis.
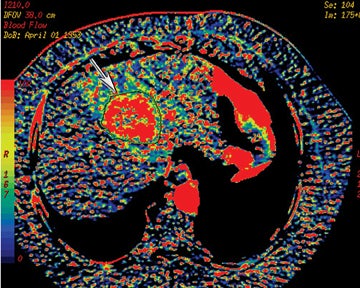
Perfusion CT or functional multidetector-row CT (f-MDCT) with appropriate software can be performed with contrast medium to assess vascular characteristics, such as blood flow (BF), blood volume (BV), mean transit time (MTT), and permeability surface area product (PS) in a variety of organs and tumors.17,18 Perfusion multidetector-row CT study techniques are continually evolving, but they are typically performed with a cine (continuous scan) technique after intravenous contrast injection of nonionic iodinated contrast. For example, a dual-phase approach can be used for pathology in the abdomen and pelvis. With such an approach, a phase I cine mode is performed over a 30 to 40 sec breath hold while the scanner is stationary. In phase II, a delayed scan is obtained consisting of short intermittent helical scans, each obtained during a 7-sec breath hold obtained at 15 sec intervals. The CT perfusion data are then analyzed on an imaging workstation where a region of interest (ROI) can be drawn over a pixel, artery, or vein to obtain time contrast-enhancement curves. The software can then be used to generate and depict parameters, such as CBF, CBV, or MTT as color-coded images (Figure 14).
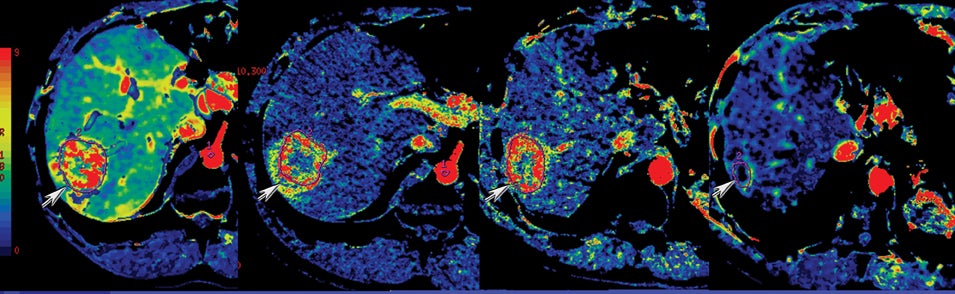
Prior studies have demonstrated increased microvascular permeability in aggressive tumors with typically a decreased permeability in response to antiangiogenic treatment. This has been shown to correlate with decreased tumor growth.19,20 Other clinical applications for f-MDCT include potentially early detection of treatment response, assessing tumor grade and prognosis, and evaluating the utility of antiangiogenesis drugs21 (Figure 15). Hoeffner et al19 have shown in their initial studies that squamous cell carcinomas of the head and neck demonstrated elevated CBF, CBV, and PS when compared to normal tissue. CT perfusion parameters have also been shown to correlate with FDG-PET measurements in assessing solitary pulmonary nodules.22 Occult hepatic metastases have also been revealed with f-MDCT where there is high perfusion.23,24 Perfusion CT has also been shown useful in monitoring treatment response on the basis of angiogenesis.21
One challenge of f-MDCT is misregistration secondary to respiration or other motion. Studies at our institution25 have shown that absolute values and reproducible CT perfusion parameters were markedly influenced by motion and data acquisition time for liver tumors. Thus, additional work is needed to correct for motion misregistration. Inconsistency in defining the ROI by those performing the measurements is also a concern.26 It has also been estimated that a CT perfusion acquisition results in an additional 1 to 5 mSv in radiation dose, depending on the region imaged.21
Manufacturers continue to work toward resolving such challenges. In addition, attempts are being made to increase the region of anatomic coverage. Manufacturers such as Toshiba have developed 320-detector row scanners that permit 16 cm of coverage by perfusion imaging. Other manufacturers, such as Siemens and General Electric, utilize a “shuttle” or “rocker” technique that can greatly increase the coverage of perfusion imaging over that of a traditional stationery approach to cine data acquisition.
Iterative reconstruction
CT use has dramatically increased in recent years, owing to its wide availability, speed, and robust diagnostic capabilities. Almost 69 million CT examinations were performed in 2007.27 It has been estimated that more than two-thirds of radiation exposure associated with medical imaging is due to CT.28,29 This has resulted in widespread public concern, making CT dose reduction a priority at many institutions. This has especially become a consideration particularly for cured, or likely to be cured, cancer patients who may require frequent follow-up CT scans to exclude recurrent disease.
CT reconstruction has traditionally been performed by filtered back projection (FBP). Dose reduction is difficult with this technique, as reduction results in readily perceived increased noise. An alternative is iterative reconstruction (IR): iDose (Philips), IRIS (Siemens), AIDR (Toshiba), and ASiR (GE). Iterative reconstruction is an algorithm whereby image data are modified through the use of advanced mathematical models.30 More specifically, IR is a method to reconstruct 2-dimensional and 3-dimensional images from measured projections of an object, beginning with an initial “guess” of the object composition and iteratively improving on it by comparing a synthesized projection from the object estimate with the acquired projection data and making incremental changes to the previous “guess.”31 Unlike traditional FBP, IR has a high computational cost. IR improves image quality by reducing image noise, thereby facilitating images at lower radiation doses. Schindera et al32 demonstrated in a phantom study that a 100-kVp abdominal CT protocol with iterative reconstruction algorithm for simulated intermediate-sized patients increased image quality and maintained diagnostic accuracy at a lower radiation dose compared with a 120-kVp imaging protocol with an FBP algorithm. Hara et al 33 found that a CT dose index reduction of 32% to 65% could be obtained with iterative reconstruction with no significant change in image quality compared to routine-dose CT imaging. Prakash et al34 also demonstrated a 9.2% decrease in image noise with ASiR 20% blend and a 37.2% decrease with ASiR 40% blend. However, they noted that ASiR 40% or > can produce artifacts at the tissue interfaces (Figure 16). A new technique known as model based iterative reconstruction promises further noise reduction through the use of even more advanced, and more computationally intensive, models.
CT postprocessing
Current MDCT can provide isotropic datasets that can be postprocessed in a variety of ways. These include multiplanar reformations, minimum intensity projections (MinIP) to show low-density structures like the biliary tree, MIP for high density structures like vessels, curved planar reformations to simplify depiction of curving structures, such as ducts or vessels, and volume rendering. These techniques can be applied to such data for problem solving or to facilitate communication of findings. Segmentation techniques, which allow for various objects (tumor, vessels, bone, etc.) to be distinguished from one another and treated differently with postprocessing techniques, have also advanced with increasing computer processing power.
Multiplanar reconstruction permits creation of images that display anatomy and pathology in an orientation other than that of the source images.35 This relatively simple postprocessing technique, easily created on modern CT scanners, has been described as a powerful tool to display and communicate complex anatomic and pathologic information. It also has shown to help improve the visualization of abdominal anatomy and pathology.36 In the pancreatic cancer patient, our experience has shown that this technique is particularly useful in staging and preoperative planning (Figure 17). To see Figure 17 in our DICOM viewer, click here.
New advances include the ability to segment structures from different phases of a multiphasic exam, and to “glue” or register these objects to create a single 3D model. For example, the arteries and tumor from the pancreatic parenchymal phase of a dual phase pancreas protocol CT can be segmented and rendered together with the portal vein from the portal venous phase of the same study (Figure 18). Previously, only poorly opacified veins from the pancreatic parenchymal phase could be depicted together with arteries and tumor, leading to a suboptimal depiction of tumor, arteries, and veins. It is notable, however, that techniques that rely on editing, such as segmentation for volume rendering and plotting of points for curved planar reformations, depend on a thorough understanding of anatomy and the ability to discriminate pathology from normal anatomy. Therefore, having images obtained from such postprocessing checked by a radiologist to confirm that they accurately reflect the patient’s findings is important. Simpler techniques, such as MIP images can provide an overview of vascular structures, while minIP images can provide an overview of, for example, biliary obstructive changes from Klatskin tumors, or the relationship of pancreatic cystic tumors to adjacent ducts (Figures 19 and 20).
One of the challenges has been workflow. Traditionally, these large datasets had to be pushed to a workstation, often remote from where a radiologist was reading studies. Recent developments, such as thin-client architecture, allow for a small computer program, a “thin” client, to be installed on a reading station. This client software communicates with a server with sophisticated hardware (graphics cards, advanced processors, and large amounts of RAM and hard disk space), the large patient dataset, and software. The thin-client allows the data to be manipulated with a speed and responsiveness similar to that of the older workstation model.
An even newer development is that of “cloud computing.” Cloud computing has been described as an approach to computing in which resources and information are provided through services over the Internet, in which the network of services is collectively known as “the cloud.”37 In short, data are moved from the local desktop or hardware to large centers elsewhere, potentially far outside the medical institution. Benefits include the medical institutions’ ability to scale to adjust their need, growing when needed and only when needed. The software can be kept continuously up to date if the company provides such resources. Challenges that remain include issues of security as well as dependence on very robust networks.
Conclusion
Computed tomography continues to evolve at a rapid pace. Recent advances include dual-energy imaging, perfusion imaging, iterative reconstruction, and evolving postprocessing techniques. With the generation of material-based images acquired through DECT, the detection of subtle enhancements, and with improved artifact reduction, MDCT techniques have the potential to significantly impact the diagnosis, staging, and management of cancer.
References
- Silva AC, Morse BG, Hara AK, et al. Dual-energy (spectral) CT: Applications in abdominal imaging. Radiographics. 2011;31:1031-1046; discussion 1047-1050.
- Nicolaou S, Yong-Hing CJ, Galea-Soler S, et al. Dual-energy CT as a potential new diagnostic tool in the management of gout in the acute setting. AJR Am J Roentgenol. 2010;194:1072-1078.
- Glazebrook KN, Guimaraes LS, Murthy NS, et al. Identification of intraarticular and periarticular uric acid crystals with dual-energy CT: Initial evaluation. Radiology. 2011;261:516-524.
- Manglaviti G, Tresoldi S, Guerrer CS, et al. In vivo evaluation of the chemical composition of urinary stones using dual-energy CT. AJR Am J Roentgenol. 2011;197:W76-W83.
- Graser A, Johnson TRC, Hecht EM, et al. Dual-energy CT in patients suspected of having renal masses: Can virtual nonenhanced images replace true nonenhanced images? Radiology. 2009 ;252:433-440.
- Altenbernd J, Heusner TA, Ringelstein A,et al. Dual-energy-CT of hypervascular liver lesions in patients with HCC: Investigation of image quality and sensitivity. Eur Radiol. 2011;21:738-743.
- Sigal-Cinqualbre AB, Hennequin R, Abada HT, et al. Low-kilovoltage multi-detector row chest CT in adults: Feasibility and effect on image quality and iodine dose. Radiology. 2004;231:169-174.
- Karhunen PJ. Benign hepatic tumours and tumour like conditions in men. J Clin Pathol. 1986; 39(2):183-188.
- Lin XZ, Wu ZY, Tao R, et al. Dual energy spectral CT imaging of insulinoma-Value in preoperative diagnosis compared with conventional multi-detector CT. Eur J Radiol. 2011 (Epub ahead of print)
- Ichikawa T, Erturk SM, Sou H, et al. MDCT of pancreatic adenocarcinoma: Optimal imaging phases and multiplanar reformatted imaging. AJR Am J Roentgenol. 2006;187:1513-1520.
- Macari M, Spieler B, Kim D, et al. Dual-source dual-energy MDCT of pancreatic adenocarcinoma: Initial observations with data generated at 80 kVp and at simulated weighted-average 120 kVp. AJR Am J Roentgenol. 2010;194:W27-W32.
- Yu L, Primak AN, Liu X, McCollough CH. Image quality optimization and evaluation of linearly mixed images in dual-source, dual-energy CT. Med Phys. 2009;36:1019-1024.
- Vrtiska TJ, Takahashi N, Fletcher JG, et al. Genitourinary applications of dual-energy CT. AJR Am J Roentgenol.2010;194:1434-1442.
- Tran DN, Straka M, Roos JE, et al. Dual-energy CT discrimination of iodine and calcium: Experimental results and implications for lower extremity CT angiography. Acad Radiol. 2009;16:160-171.
- Jeswani T, Padhani AR. Imaging tumour angiogenesis. Cancer Imaging. 2005;5:131-138.
- Gilles R, Zafrani B, Guinebretiere JM, et al. Ductal carcinoma in situ: MR imaging-histopathologic correlation. Radiology. 1995;196:415-419.
- Blomley MJ, Coulden R, Bufkin C, et al. Contrast bolus dynamic computed tomography for the measurement of solid organ perfusion. Invest Radiol. Nov 1993;28 Suppl 5:S72-77; discussion S78.
- Miles KA, Leggett DA, Kelley BB, et al. In vivo assessment of neovascularization of liver metastases using perfusion CT. Br J Radiol. 1998;71:276-281.
- Hoeffner EG, Case I, Jain R, et al. Cerebral perfusion CT: Technique and clinical applications. Radiology. 2004;231:632-644.
- Roberts HC, Roberts TPL, Brasch RC, Dillon WP. Quantitative measurement of microvascular permeability in human brain tumors achieved using dynamic contrast-enhanced MR imaging: Correlation with histologic grade. AJNR Am J Neuroradiol. 2000;21:891-899.
- Miles KA. Functional computed tomography in oncology. Eur J Cancer. 2002;38:2079-2084.
- Miles KA, Griffiths MR, Fuentes MA. Standardized perfusion value: Universal CT contrast enhancement scale that correlates with FDG PET in lung nodules. Radiology. 2001;220:548-553.
- Leggett DA, Kelley BB, Bunce IH, Miles KA. Colorectal cancer: Diagnostic potential of CT measurements of hepatic perfusion and implications for contrast enhancement protocols. Radiology. 1997;205:716-720.
- Dugdale PE, Miles KA. Hepatic metastases: The value of quantitative assessment of contrast enhancement on computed tomography. Eur J Radiol. 1999;30:206-213.
- Ng CS, Chandler AG, Wei W, et al. Reproducibility of CT perfusion parameters in liver tumors and normal liver. Radiology. 2011;260:762-770.
- Henderson E, Milosevic MF, Haider MA, Yeung IW. Functional CT imaging of prostate cancer. Phys Med Biol. 2003;48:3085-3100.
- 2007 CT market summary report. Des Plaines, IL: IMV Medical Information Division;2007.
- Kalra MK, Maher MM, Toth TL, et al. Strategies for CT radiation dose optimization. Radiology. 2004;230:619-628.
- Linton OW, Mettler FA. National conference on dose reduction in CT, with an emphasis on pediatric patients. AJR Am J Roentgenol. 2003;181:321-329.
- Hara AK, Paden RG, Silva AC, et al. Iterative reconstruction technique for reducing body radiation dose at CT: Feasibility study. AJR Am J Roentgenol. 2009;193:764-771.
- Xu J, Mahesh M, Tsui BM. Is iterative reconstruction ready for MDCT? J Am Coll Radiol. 2009;6:274-276.
- Schindera ST, Diedrichsen L, Muller HC, et al. Iterative reconstruction algorithm for abdominal multidetector CT at different tube voltages: Assessment of diagnostic accuracy, image quality, and radiation dose in a phantom study. Radiology. 2011;260:454-462.
- Hara AK, Paden RG, Silva AC, et al. Iterative reconstruction technique for reducing body radiation dose at CT: Feasibility study. AJR Am J Roentgenol. 2009;193:764-771.
- Prakash P, Kalra MK, Kambadakone AK, et al. Reducing abdominal CT radiation dose with adaptive statistical iterative reconstruction technique. Invest Radiol. 2010;45:202-210.
- Cody DD. AAPM/RSNA physics tutorial for residents: Topics in CT. Image processing in CT. Radiographics. 2002;22:1255-1268.
- Hong C, Bruening R, Schoepf UJ, et al. Multiplanar reformat display technique in abdominal multidetector row CT imaging. Clin Imaging. 2003;27:119-123.
- Andriole KP, Khorasani R. Cloud computing: What is it and could it be useful? J Am Coll Radiol. 2010;7:252-254.