Potential of quantitative 3D analysis of CT bone images for hip osteoarthritis
Quantitative 3D analysis of the proximal femur can identify changes in cortical bone thickness relevant to structural hip osteoarthritis, according to an article published in European Radiology. The multi-institutional study from the United Kingdom suggests that cortical bone mapping could have an impact on both osteoarthritis research and subsequent clinical practice with respect to disease monitoring and the development of structurally modifying therapies.
MRI is the imaging modality predominantly being used in osteoarthritis research to identify disease-modifying treatment. However, CT imaging is increasingly being used to assess involvement in osteoarthritis. Recently published research suggests that careful alignment of therapeutic action, tissue response and imaging may yield the greatest chance of detecting longitudinal change.1 Results of the Strontium ranelate Efficiency in Knee Osteoarthritis trIAl (SEKOIA) determined that its treatment was associated with a significant effect on structure modification in patients as well as a beneficial effect on reducing symptoms of pain at a higher dose.2 Future research of strontium ranelate may require accurate monitoring of mineralized tissues. A multidisciplinary team of radiologists, engineers and physicians has been attempting to develop a new method for disease quantification of osteoarthritis to contribute to this path of research.
Lead author Tom Turmezei of the Department of Engineering at the University of Cambridge and co-authors hypothesized that cortical bone mapping (CBM) could help identify regions of cortical bone thickening around the proximal femur associated with worse radiological osteoarthritis. They predicted that this would be in the distribution of recognized peri-articular bone-related phenomena such as osteophytes and subchondral sclerosis.
The researchers conducted an observational study with 203 female control volunteers participating in University of Cambridge clinical trials investigating hip fracture risk. None of the participants had hip fracture, osteomyelitis, bone malignancy, unilateral metabolic bone disease, or prior treatment with teriparatide or strontium ranelate. A radiologist reviewed CT images to grade disease severity and osteophyte load. They then performed CBM, a technique that can accurately estimate cortical bone thickness beyond the resolution limit of CT. Each bone was registered to a canonical femur, after which statistical parametric mapping (SPM) was performed to determine regions of significantly different cortical thickness for changes in radiological disease score.
>
Cortical bone mapping results were calculated for three measures of disease. These included a CT-based osteophyte load, minimum joint space width, and Kellegren and Lawrence (K&L) grade. They were displayed as a color map on a canonical model. Nonsignificant regions according to SPM were masked as faded colors, and significant regions of increased cortical bone thickness with worsening disease score were represented in full color.
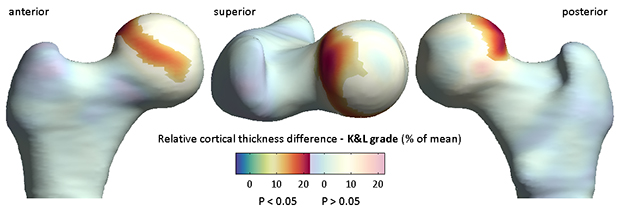
Figure 1. Results of statistical parametric mapping according performed on cortical thickness maps from 203 female volunteers. This example shows where a statistically significant increase in cortical thickness occurred for each increase in radiological Kellgren and Lawrence grade across the cohort. The largest effect was seen at the superolateral head-neck junction and superior subchondral bone plate, where there was up to 25% relative increase in cortical thickness for each increase in grade (~ 0.1 mm for each grade). Non-significant regions are shown as washed out color.
The authors reported that for each increase in K&L grade, cortical thickness increased by up to 25% in distinct areas of the superolateral femoral head-neck junction and superior subchondral bone plate (Figure 1). The increase in cortical thickness for increasing severity of CT osteophytes was distributed more circumferentially. There were no significant results for minimum joint space width.
Regions of increased thickness co-located with areas implicated in impingement and osteophyte formation. The authors commented that “a relative increase in cortical bone thickness at the same site across all scores suggests that this region may be involved in a particular manifestation of disease.”
“We believe that CBM should now be tested to show whether quantitative 3D measurement of cortical bone with clinical CT can predict clinical disease with the necessary levels of sensitivity and precision,” the authors wrote. But, they cautioned, “before considering the next phase of validation for assessment of osteoarthritis with CBM, it is important to evaluate the implications of using clinical CT for this purpose. … The promotion of CT for imaging large joint osteoarthritis should, therefore, be balanced against its weaknesses and the inherent values of other modalities such as MRI and radiography.
REFERENCES
- Reginster J-Y, Badurski J, Bellamy N, et al. Efficacy and safety of strontium ranelate in the treatment of knee osteoarthritis: results of a double-blind, randomised, placebo-controlled trial. Ann Rheum Dis. 2014 73;2:e8.
- Eckstein F, Guermazi A, Gold G, et al. Imaging of cartilage and bone: promises and pitfalls in clinical trials of osteoarthritis. Osteoarthr Cartil. 2014 22: 1516-1532.
- Turmezei TD, Treece GM, Gee AH, et al. Quantitative 3D analysis of bone in hip osteoarthritis using clinical computed tomography. Eur Radiol. 26: 2047-2054.
Citation
Potential of quantitative 3D analysis of CT bone images for hip osteoarthritis. Appl Radiol.
July 5, 2016