Silver lining: Imaging manifestations of pleural pathology
By Kao S, Yen A, Nakanote K, Brouha S
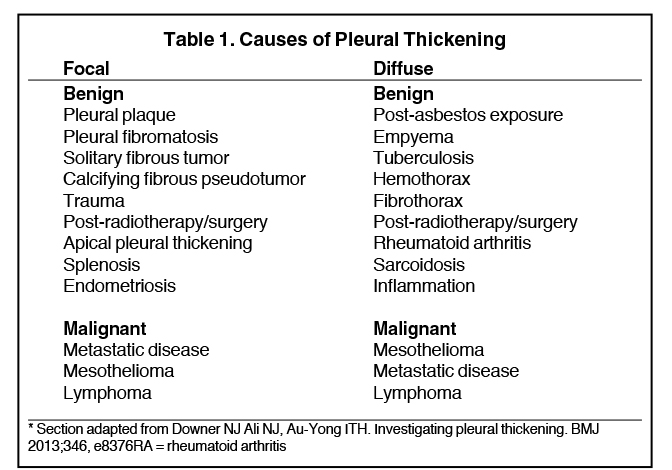
Pleural pathology varies widely and may manifest with one or more of the following: intrapleural liquid or gas, pleural thickening, and high attenuation. Liquid in the pleural space, or pleural effusions, may be made conspicuous on chest radiographs by size or patient positioning, but identifying subtle findings may allow diagnosis of an effusion and its etiology. Similarly, gas in the pleural space, or a pneumothorax, may have both classic and elusive imaging findings, often necessitating distinction from other entities. Pleural thickening may be focal or diffuse, benign or malignant, with characteristic imaging features that can narrow the differential diagnosis (Table 1). Calcification or other high attenuation within the pleural space is commonly due to asbestos exposure, chemical pleurodesis, and remote trauma or infection. We will review multimodality-imaging features used to establish the presence and cause of the various types of pleural pathology. In addition, we will discuss the imaging features of complex pleural-parenchymal abnormalities, with special consideration of bronchopleural fistulas, unexpandable lung, and post-pneumonectomy complications.
Pleural effusions
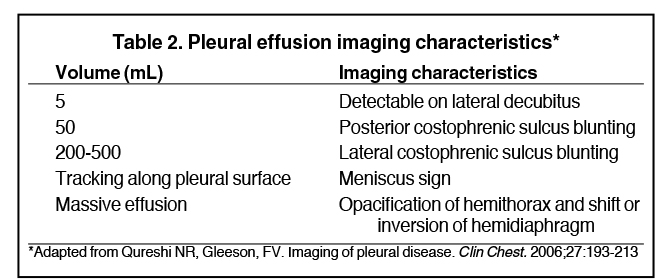
Pleural effusions result from abnormal buildup of a thin layer of liquid that normally helps adhere and lubricate the interface between visceral and parietal pleura. As the volume of an effusion increases, its appearance on imaging1 becomes more evident (Table 2). The classic and most obvious presentation of a small pleural effusion on a radiograph is blunting of the lateral or posterior costophrenic sulcus, a form of parietal-visceral pleural separation.1 Medial blunting on frontal view may be apparent. Absence of blunting does not negate an effusion.
Parietal-visceral pleural separation may manifest in other ways, such as apical capping or thickening of the paraspinal stripe.2 Visceral-visceral pleural separation, such as widening of the oblique fissure on lateral projection, may also indicate a pleural effusion.1 When an effusion is only partially well-marginated on chest radiograph, this is known as the incomplete border sign.3
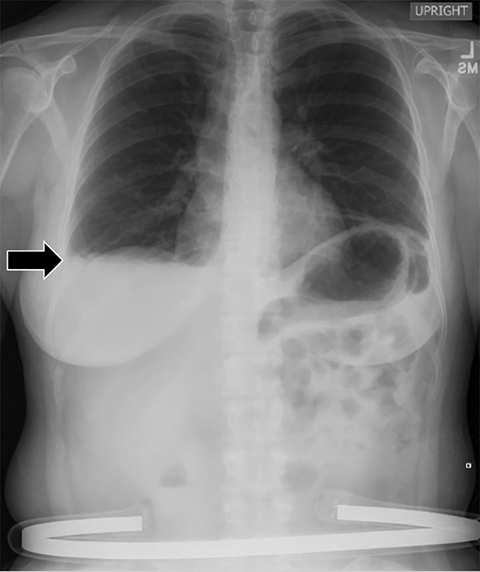
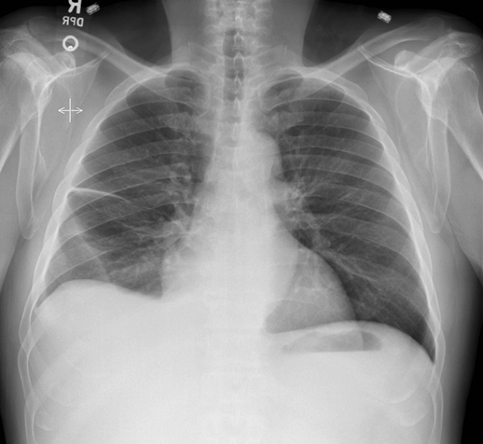
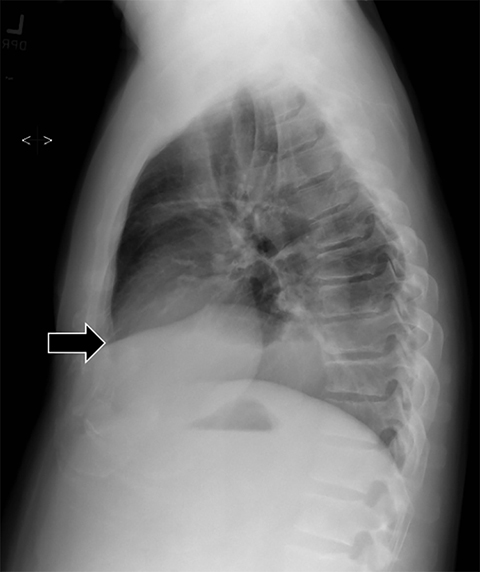
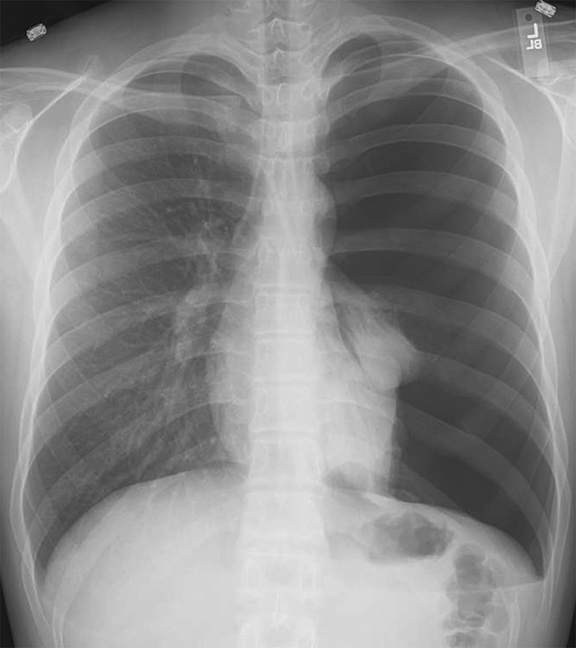
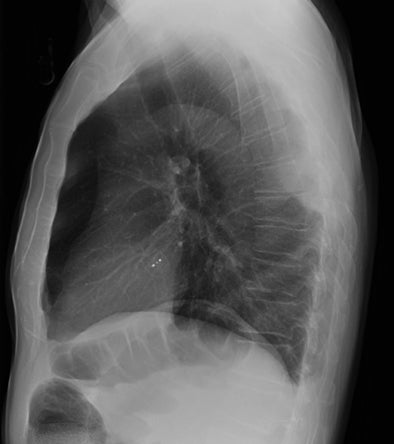
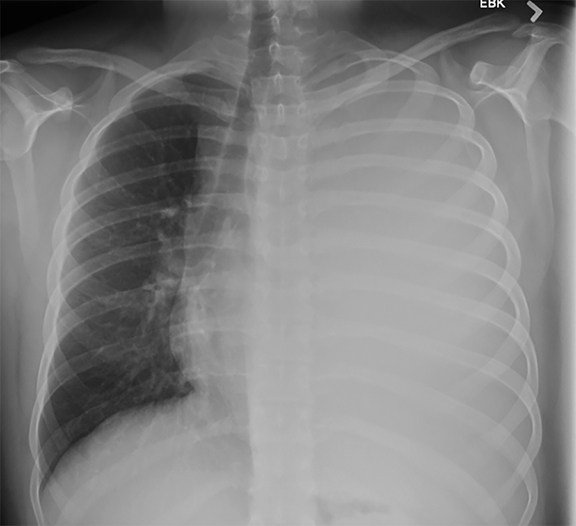
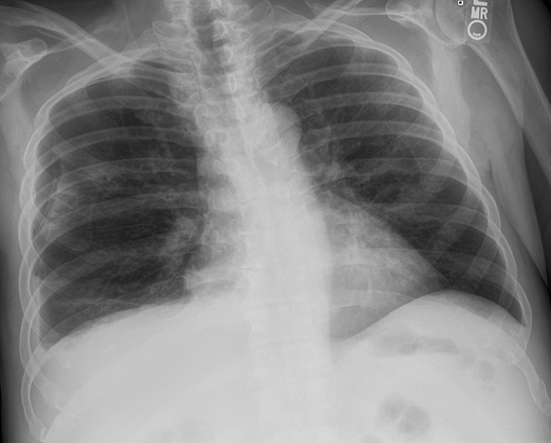
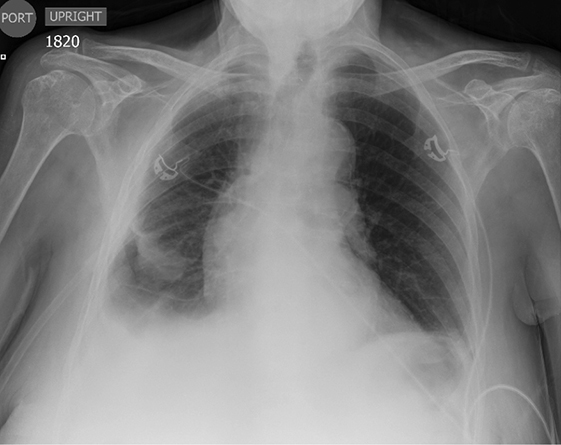
Subpulmonic effusions between the dome of the diaphragm and basal lung are suggested on frontal projection by elevation and lateralization of the hemidiaphragmatic peak, a paucity of vessels below the diaphragmatic margin, and increased distance between the left lung base and gastric bubble (Figure 1). On a lateral view, a subpulmonic effusion may have an appearance likened to the “Rock of Gibraltar” — an angulated contour of the lung base with the peak at the oblique fissure (Figure 2).4 Subpulmonic effusions may demonstrate lateralization of hemidiaphragm on frontal radiograph (Figure 3). When bilateral, subpulmonic effusions may be mistaken for hypoventilation.
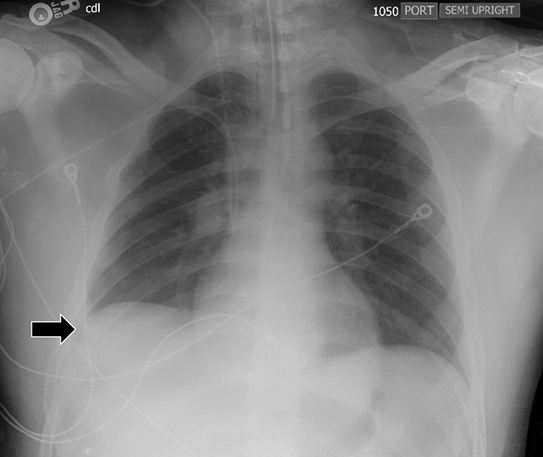
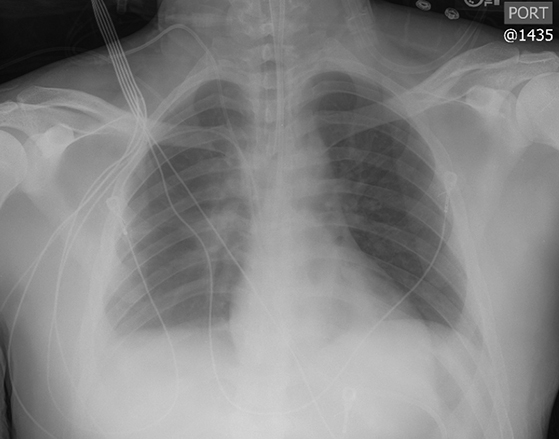
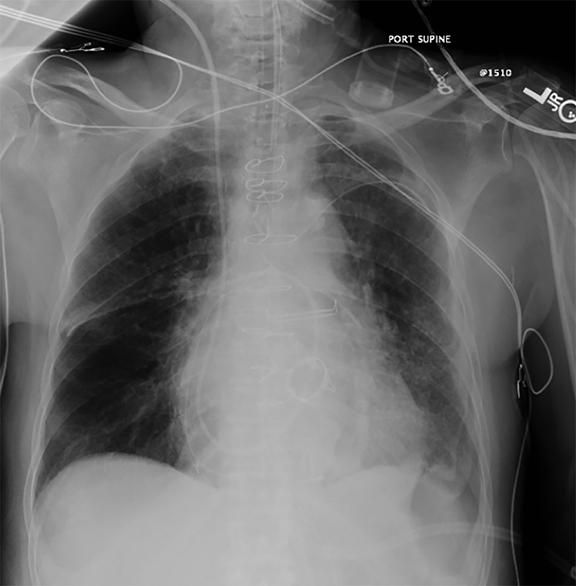
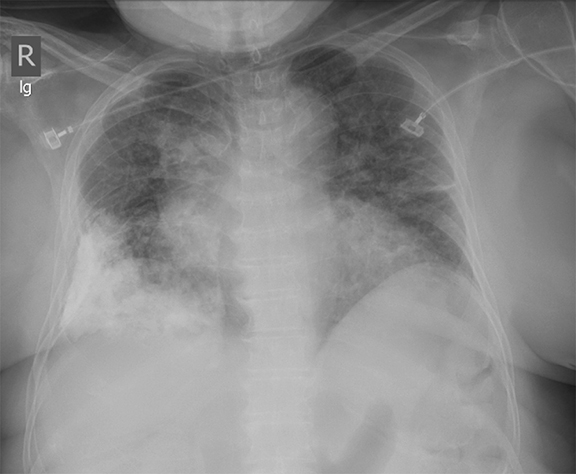
Supine positioning causes a layering pleural effusion to distribute posteriorly, causing hazy or veil-like opacification of the hemithorax with preservation of bronchovascular structures (Figure 4).5 Pitfalls in the determination of pleural effusions, regardless of patient positioning, include overlying soft tissue, atelectasis, extrapleural fat, pericardial fat, and pleural thickening. Lateral decubitus imaging may be utilized for confirmation.
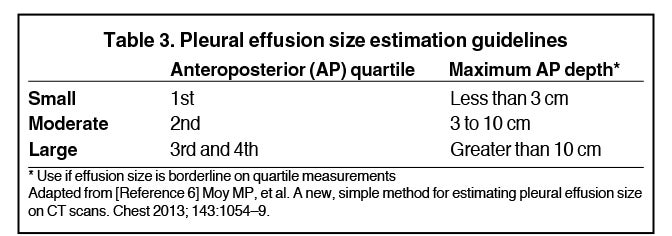
Although pleural effusions are often easily identified on computed tomography (CT), trace effusions may go undetected at the extreme posterior costophrenic sulci or immediately posterior to the descending thoracic aorta. Recently, attempts have been made to standardize effusion quantity on CT. Moy et al have proposed a three-point scale6 based on anteroposterior quartile and maximum anteroposterior depth (Table 3).
The differential diagnosis of air space disease (water, blood, pus, or cells) can similarly be applied to pleural effusions. Distinguishing between transudative and exudative pleural effusions helps identify the etiology and aids in management. Transudates imply hydrostasis (eg, left ventricular failure, hypoalbuminemia) while exudates imply capillary permeability (eg, malignancy, parapneumonic effusion).
On imaging, this distinction can be difficult. For example, one might define a gravitationally dependent and water attenuating effusion as simple, but this does not necessarily denote a transudate.7 For example, a parapneumonic effusion represents an exudate (likely from vessel permeability and leakage of inflammatory cells) but is typically sterile at the outset and may appear simple. A minority of patients will develop secondary infection of the effusion itself, predisposing to complexity and eventually frank empyema (discussed later).8 Pseudotumors are another example—often associated with congestive heart failure, hypoalbuminemia, or renal insufficiency, these transudative effusions do not appear simple. Instead, they manifest as interlobar well-demarcated, lenticular collections with tapered ends, most commonly seen along the minor fissure (Figure 5).
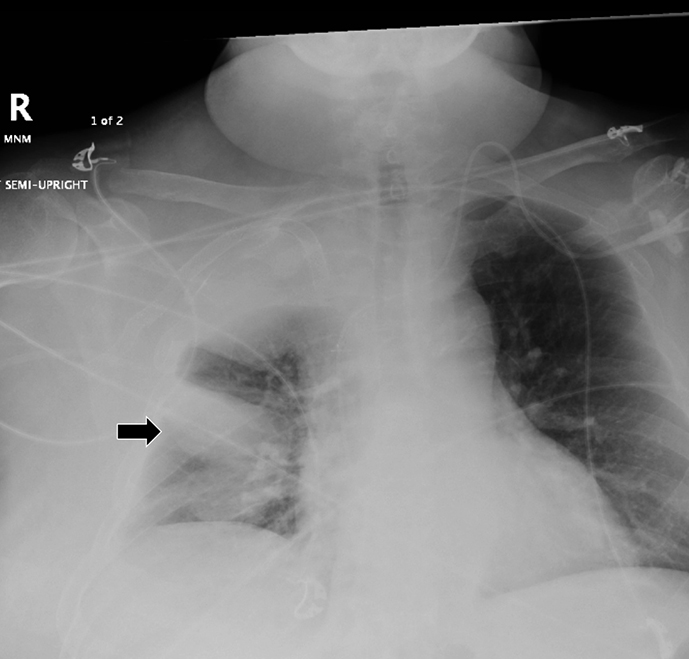
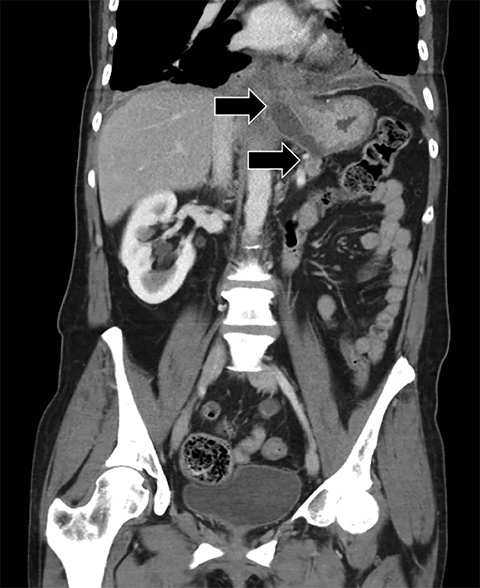
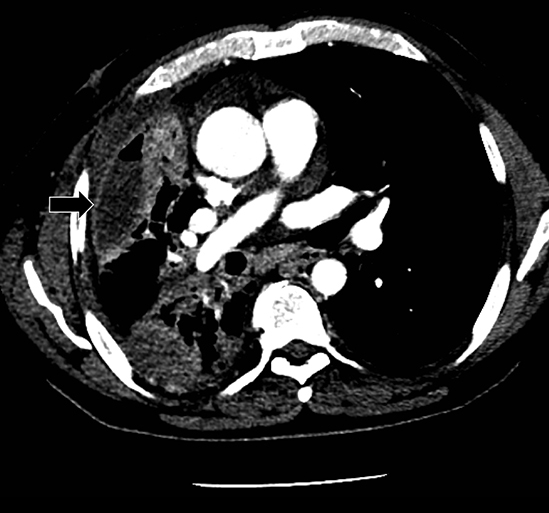
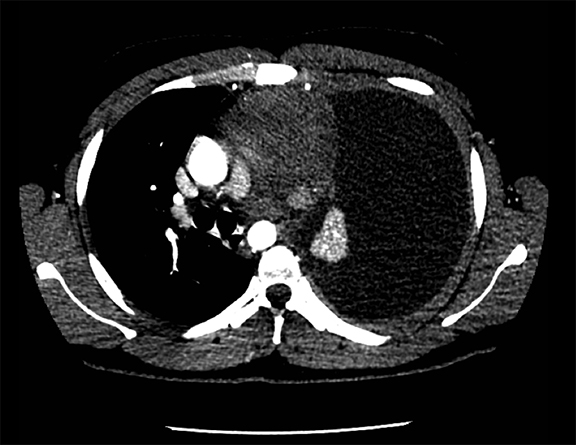
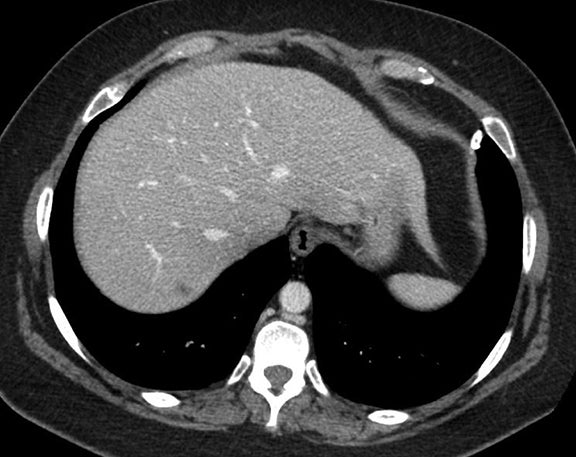
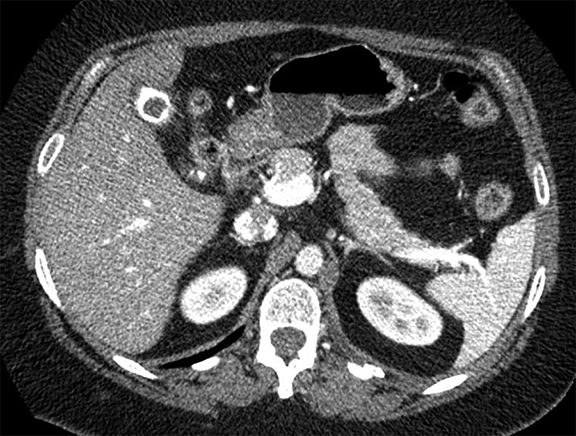
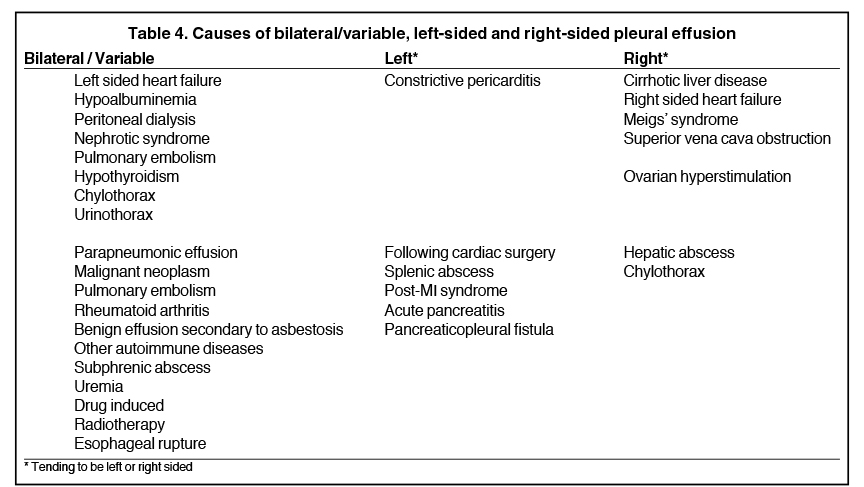
Complex effusions on imaging are more reliably exudative. Thickening and increased attenuation of extrapleural fat may be associated with both transudates and exudates, but are more likely to be found in exudative effusions (Table 2). The long-term presence of a pleural effusion, even if unchanged in size, should raise the possibility of active tuberculous empyema. Pulmonary thromboembolic disease should be considered in the appropriate setting. The laterality of an effusion occasionally sheds light on the etiology (Table 4). For example, a left-sided effusion could reflect an acute pancreatitis due to formation of a fistulous tract or direct extension of a pseudocyst across the diaphragm (Figure 6).
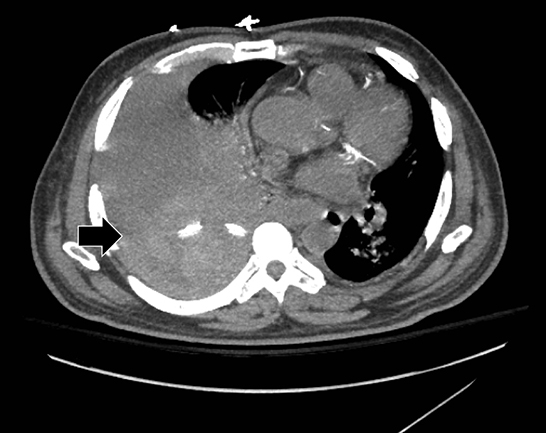
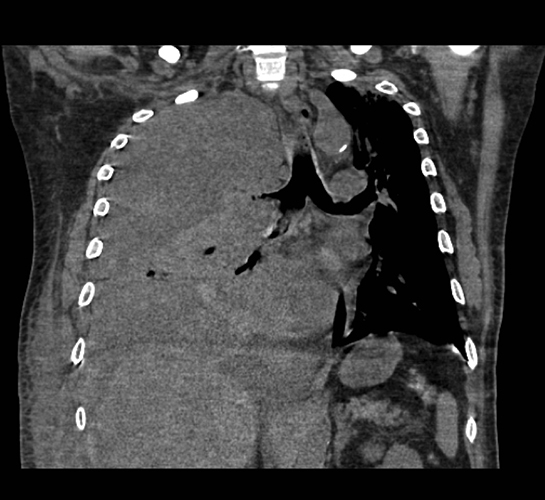
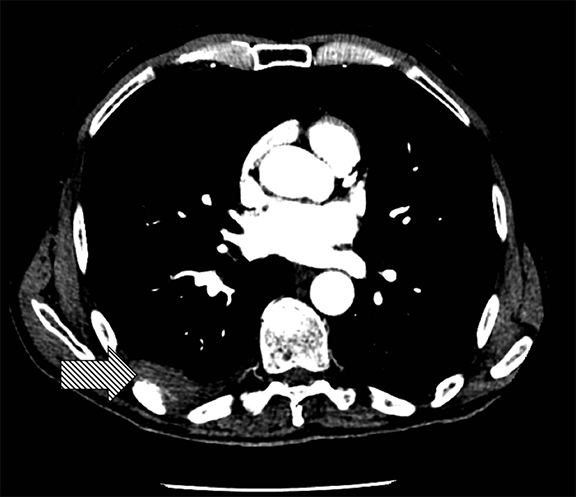
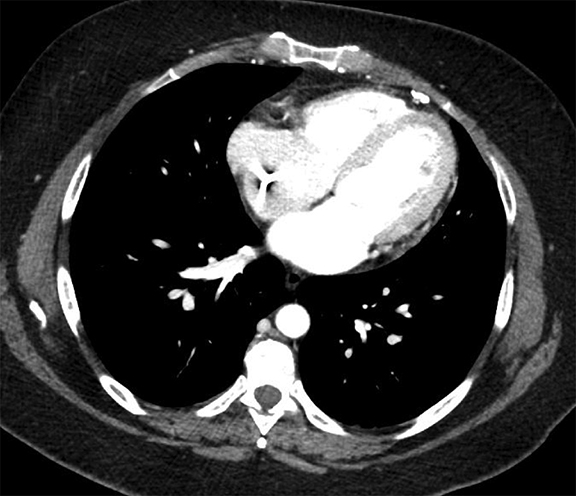
The utility of measuring the attenuation of a pleural effusion is inconsistent as pseudoenhancement may occur with intravenous contrast. Interpretation is always best made in conjunction with the clinical history and ancillary imaging findings. For example, a pleural effusion with high attenuation and debris fits the impression of a hemothorax in the setting of trauma and ipsilateral rib fractures. Hemothoraces measure in excess of 35 Hounsfield units (HU) when acute and up to 70 HU when clotted. A liquid-liquid interface would result from differing densities of red blood cells and serum (Figure 7). Likewise, a pleural effusion with attenuation of fat (approximately -90 to -115 HU) may suggest the presence of a pseudochylous (or chyliform) pleural effusion, which has high lipid content and has been described with tuberculous pleurisy and rheumatoid arthritis.9 Chylothoraces, or true chylous effusions, occur with lymphomas, bronchogenic carcinomas and trauma, and may also have negative attenuation values.
Magnetic resonance imaging (MRI) can be useful to further characterize an effusion. For example, a hemothorax with hyperacute blood manifests as low T1 and high T2 signal whereas acute or chronic blood that is several hours old or older has low signal on both T1 and T2. In cases with an unclear etiology, diagnostic thoracentesis with pleural fluid analysis is the gold standard test.
Pneumothorax
The telltale sign of a pneumothorax is a white visceral pleural interface. This may be overlooked medially and at the base, even in the upright position. Although pulmonary vessels should not extend beyond the visceral pleura, lung tissue superimposed upon a pneumothorax, particularly at the base, may conceal the pneumothorax save for the presence of a white visceral pleural interface.
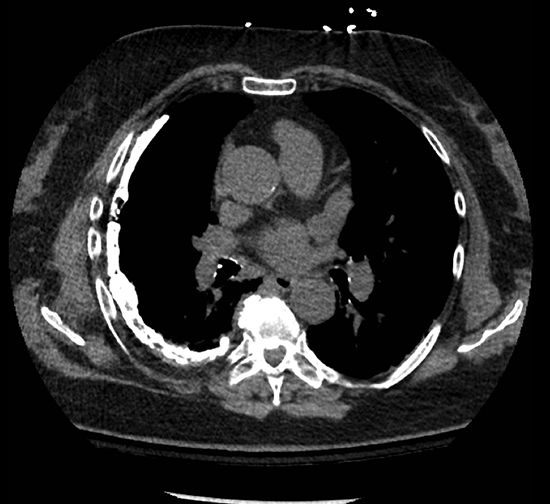
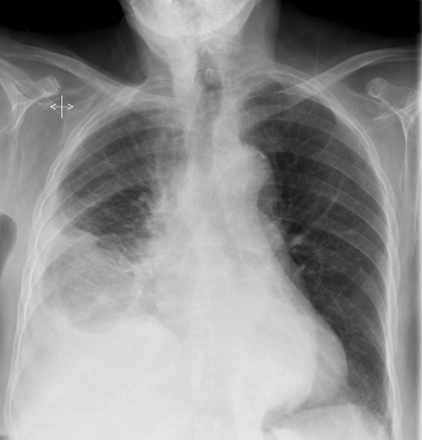
A pneumothorax disrupts the visceral-parietal interface, allowing the lung to naturally recoil and surrounding structures to relax. This may manifest as mediastinal shift, rib interspace widening, and hemidiaphragmatic depression. Tension pneumothorax, an emergent finding associated with hemodynamic instability, results from progressive build-up of gas in the chest, during which positive pleural pressure should collapse the ipsilateral lung on imaging (Figure 8). In certain instances (eg, airway obstruction or poor lung compliance), the lung may not collapse despite tension.
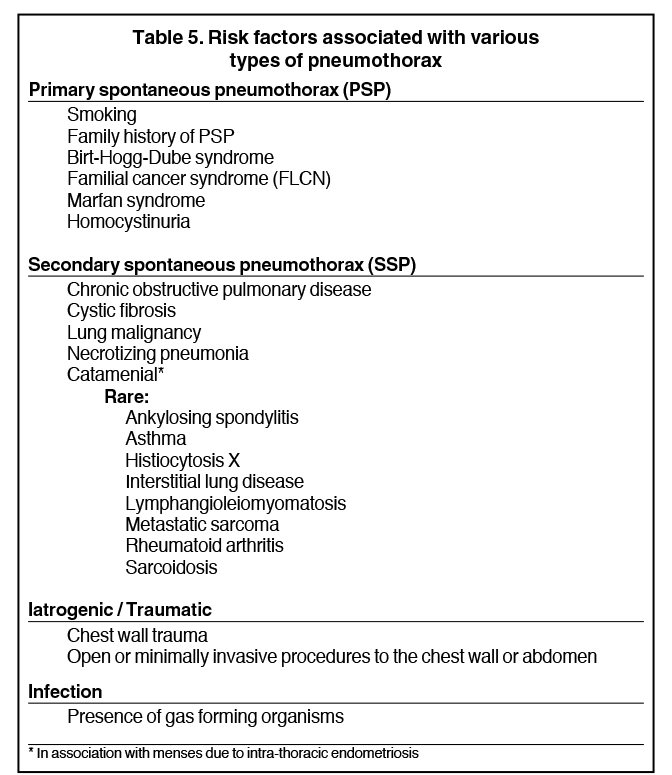
Detecting a pneumothorax on supine radiographs is more challenging. In the setting of trauma, for example, up to 63% of all pneumothoraces are not visible on chest radiography.10 In any scenario, the only clues may be asymmetric lucency or unusual sharpness of anatomical borders. Ideally this is supported by clinical suspicion or other radiographic findings (Table 5). Additional signs include the “deep sulcus” sign, a deepening and widening of the costophrenic sulcus due to intrapleural gas tracking inferolaterally,11 and the “double diaphragm” sign (Figure 9), the presence of two diaphragm-gas interfaces, classically at the dome and anterior costophrenic sulcus. Upright or decubitus positioning is usually confirmatory. Secondary signs of subcutaneous emphysema and pneumomediastinum may aid in the diagnosis.
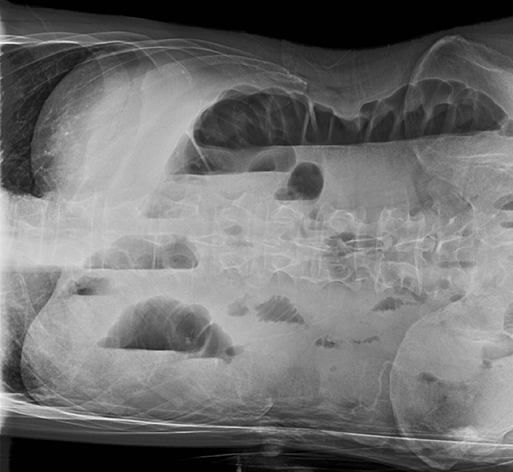
The pitfalls of radiographic diagnosis are many. The Mach effect creates the illusion of free gas due to exaggerated contrast between edges of differing shades of gray, usually seen along the mediastinum. Physically covering the offending shadow (eg, cardiac silhouette or upper rib) can eliminate this artifact. A skin fold is less of a diagnostic dilemma in that it is broad and radiographically dense with a dark edge (Figure 10). Diaphragmatic herniation of stomach may be misdiagnosed as hydropneumothorax due to the presence of gas and liquid in the pleural cavity.12 Other pitfalls include companion shadows (eg, hair), large bullae, a superimposed scapular edge, and extrapleural gas. While CT detection of a pneumothorax is usually straightforward, distinguishing a pneumothorax from large bullae can be challenging.
Several studies have explored methods to estimate the size of a pneumothorax. Familiarity with these methods proves useful when percentage size is requested by the referring provider. Studies using lung models show that this is best determined on CT.13 On radiography, one crude method (whether upright or supine) is to take the average of three interpleural distances: a craniocaudal dimension at the apex, a mediolateral dimension one-third of the way down from the apex, and a mediolateral dimension two-thirds of the way down from the apex, then multiplying this average by 10 to determine the percent pneumothorax. However, proposed methods in the literature may be consulted for further details.14–17
Pneumothoraces may be spontaneous (primary or secondary), iatrogenic/traumatic, or related to gas-forming organisms within the pleural space. Primary spontaneous pneumothorax is defined as having no apparent underlying lung disease or inciting cause, and secondary spontaneous pneumothorax results from underlying lung pathology. Clinical correlates by type of pneumothorax are shown in Table 5.
Pleural thickening
On radiographs, pleural thickening is more easily detected in profile but can be difficult to separate from effusion or extrapleural fat. Parenchymal scarring or distortion may favor thickening. When visible en face, pleural thickening is veil-like with ill- or partially defined margins. When mass-like, the classic appearance is an opacity creating an obtuse angle with the chest wall and demonstrating an incomplete border sign (Figure 10). On CT, pleural thickening may be difficult to distinguish from an effusion.
Pleural thickening is focal or diffuse and benign or malignant (Table 1). “Diffuse” has varying definitions but most commonly is described as smooth and uninterrupted pleural thickening with extent greater than one-fourth of the chest wall. A strict definition may not be crucial, as there is overlap among focal and diffuse processes (Table 1). A discussion of selected processes follows.
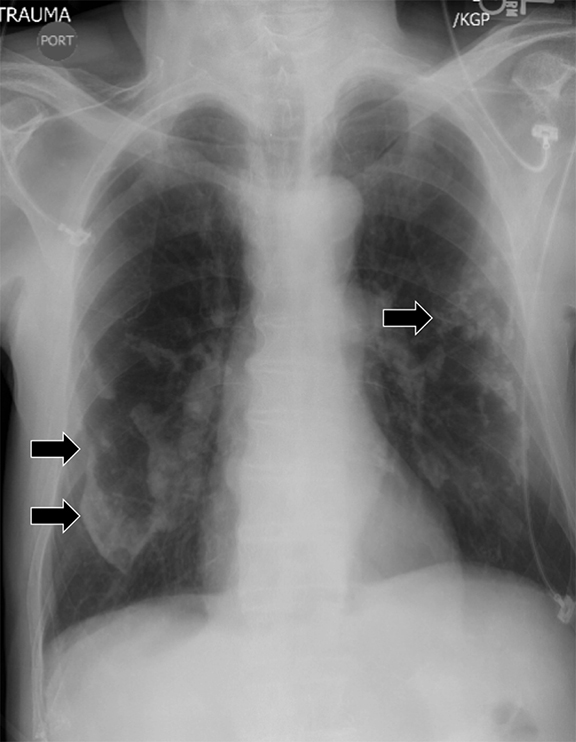
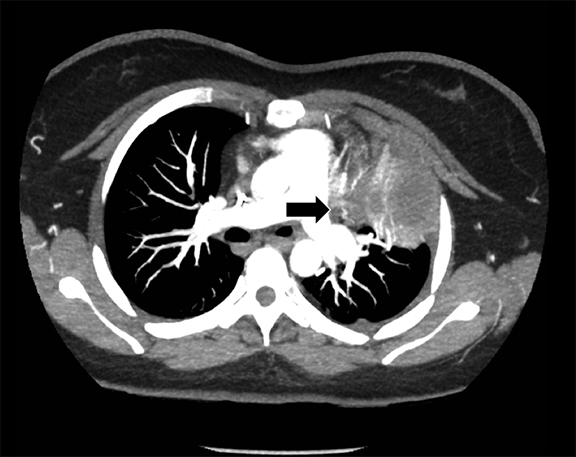
The most common causes of focal pleural thickening include: pleural plaque (often multiple), empyema, and primary or metastatic malignancy. Diffuse diseases may be inflammatory or infectious in etiology as in fibrothorax, or neoplastic (Figure 11), either primary or metastatic.
Pleural plaques, manifesting as discrete plaques or diffuse pleural thickening either unilateral or bilateral, are almost always due to asbestos-related pleural changes. Bilateral pleural thickening, whether focal or diffuse, is almost always due to asbestos-related pleural change. These typically present two to five decades after initial exposure. Pleural effusions may occur without plaques and with earlier onset after exposure. Asbestos-related pleural plaques often calcify and occur at the bases or along the diaphragm. On radiographs, a calcified pleural plaque may be likened to a holly leaf, known as the holly leaf sign (Figure 12).18 While the chest radiograph in the context of a compatible clinical history of exposure is sufficient for diagnosis, CT has greater sensitivity, particularly for early disease, and can exclude confounding conditions.19
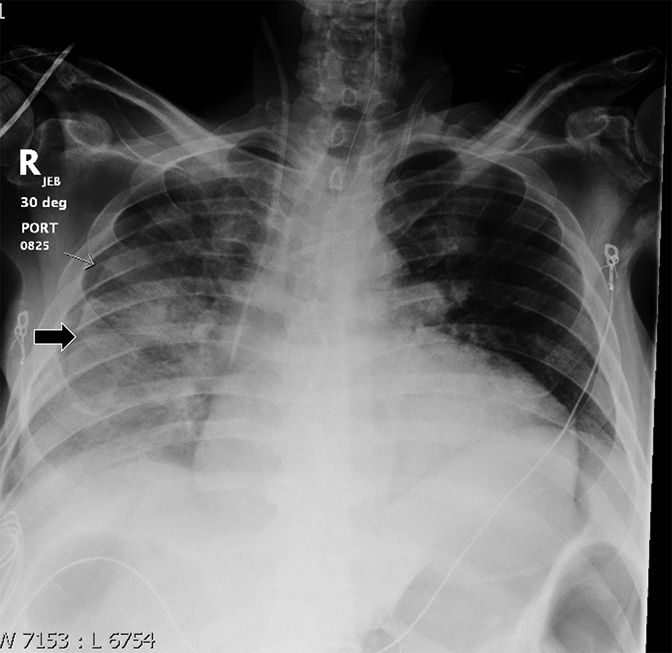
Empyemas are purulent pleural collections most readily recognized on imaging by the split pleura sign. The split pleura sign represents a rind of visceral and parietal pleural thickening surrounding a loculated effusion (Figure 13). For management purposes, the radiologist should make every attempt to distinguish an empyema from a pulmonary abscess. Empyemas typically demonstrate a lentiform shape (versus a rounded shape), obtuse chest wall angles (versus acute angles), adjacent lung compression (versus abrupt termination of bronchovascular structures at the margins), and walls that are thin, smooth, and uniform (versus thick and irregular walls).
Solitary fibrous tumors are mesenchymal neoplasms arising from the pleura that are more often benign than malignant. They occur most commonly within the thoracic cage but have been reported throughout the body (eg, soft tissues, muscles). Symptoms such as local pressure effects and pain occur more so with larger tumors. Other clinical symptoms may include hypoglycemia due to secretion of insulin-like growth factor II, hypertrophic osteoarthropathy, hemoptysis, pneumonia and constitutional symptoms. Tumors often have discrete margins, a smooth surface, continuity with the chest wall, heterogeneous enhancement (65%), and more commonly lobulated contours.20 Approximately 60% of tumors from the visceral pleura and 30% from the parietal pleura are pedunculated.20 As such, radiographs over time may show tumors in different positions. Calcifications, collateral feeding vessels, and invasion of local structures are generally absent.21
A fibrothorax is classically unilateral and represents the sequela of remote infection or trauma. It is characterized by diffuse pleural thickening that may calcify and is frequently associated with volume loss of the affected hemithorax (Figure 14).
Rounded atelectasis may form secondary to chronic pleural disease (often pleural thickening) as a result of mineral dust exposure (asbestos, silica), exudative pleural effusions, pneumothorax, and childhood cancers. It is recognized on imaging as a rounded region of parenchymal volume loss abutting the pleura, associated with a swirling of bronchovascular structures (comet tail sign) in a region of chronic pleural abnormality. These findings represent local atelectasis resulting from focal pleuritis or an infolding of visceral pleura22 (Figure 15) and may be mistaken for malignant disease.
Certain imaging features may help the radiologist distinguish malignant from benign pleural disease, including circumferential thickening, nodular pleural thickening, parietal pleural thickening greater than 1 cm, and mediastinal pleural involvement2(Figure 16).23 Neither ipsilateral volume loss nor fissural involvement has been shown to be useful in the determination of malignancy. On the other hand, the absence of “malignant” features does not necessarily indicate a benign etiology. In addition, certain benign processes occasionally reproduce one or more “malignant” findings. For example, nodular pleural thickening is an infrequent occurrence in tuberculosis and catamenial pneumothoraces. Also, left-sided pleural nodules with a history of prior trauma may reflect splenosis while empyemas occasionally involve the mediastinal pleura. Positron emission tomography (PET) is a useful adjunct in the determination of malignancy and has gained wider usage as a follow up modality for prognosis and treatment monitoring.
Metastatic disease, which despite being more common than mesothelioma with an incidence of 10% after exposure to asbestos, cannot reliably be distinguished from one another on imaging (Figure 17).9,24 Metastatic disease is often seen with adenocarcinomas (primarily from lung, breast, lymphoma, and ovary)25 and may include invasive thymoma and lymphoproliferative malignancies. However, primary effusion lymphoma affects serosa primarily and would not fall under this category. Of note, pleural dissemination of non-small cell lung cancer in the absence of a pleural effusion confers a better prognosis (a distinction of dry versus wet disease).
In any tumor localizing to lung, an effort should be made to determine the likelihood of extra-parenchymal involvement. According to Imai and colleagues, invasion may be suspected on CT when the ratio of the arch distance to the maximum tumor diameter is greater than 0.9. Arch distance refers to the length of contact between the tumor and the interface in question (eg, pleura).26 Other CT features of chest wall invasion include decreased angle between tumor mass surface and pleura interface, presence of pleural thickening, fat plane rib invasion and the presence of a chest wall mass. On MR, criteria for chest wall invasion include signal intensity of the invasive lesion similar to that of the tumor on T1-weighted images, hyperintense soft tissue signal similar to that of the tumor on T2-weighted images, and gadolinium enhancement.
High attenuation
We define high attenuation as any metallic opacity not limited to calcification. Importantly, calcification is seen in the majority of cases and suggests chronicity. The observation of pleural calcification may also favor a benign etiology. As an example, calcifications are infrequently present in the setting of malignant mesothelioma despite its association with asbestos exposure.
Commonly considered etiologies of high attenuation include remote trauma (including prior surgery), remote empyema, asbestos-related pleural change, and chemical pleurodesis. Thoracolithiasis and calcified or ossified metastases are uncommon. On imaging, bilateral involvement typically separates asbestos from the others. Ancillary findings such as thoracotomy changes or healed rib fractures would favor remote trauma.
Chemical pleurodesis from talc administration is suggested by chronic uniformly hyperattenuating multifocal pleural opacities. Talc deposits are classically found in the posterior basal regions but may present anywhere within the pleural space, including the fissures. They may mimic the “split pleura” sign of empyema due to fibrin coating of both pleural layers.27 FDG-PET uptake is a common finding.
Thoracolithiasis describes a mobile calcified or non-calcified loose body in the pleural space without prior trauma, intervention, or pleurisy. Typically incidental and benign (Figure 18), this entity does not require treatment or intervention. It tends to occur on the left and may be associated with degenerated lipomas, tuberculosis, dust inhalation, pleural fat or pericardial fat.28 The differential includes a fibrin body, foreign body granuloma, and an iatrogenically introduced gallstone.
Complex pleural-parenchymal disease
Complex pleural-parenchymal processes arise for any number of reasons. They may result from primary pleural pathology with secondary effects on the underlying lung or from primary lung pathology with secondary abnormalities of the pleural space. Here, we consider representative processes.
Fistulas
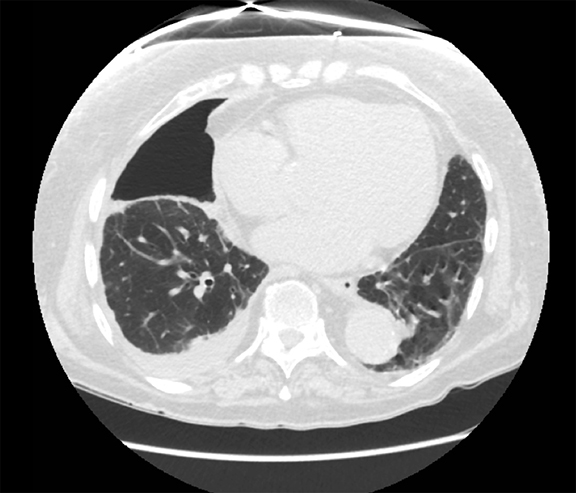
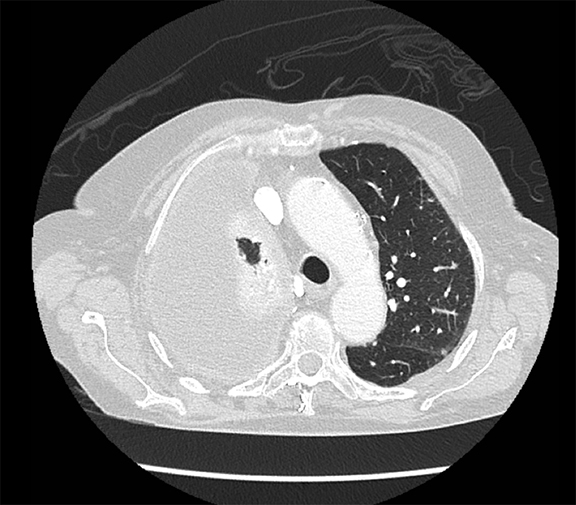
A true bronchopleural fistula (BPF) refers to communication between the pleural space and bronchial tree while a parenchymal-pleural fistula (PPF) is between pleura and parenchymal lung (Figure 19). As a whole, these are typified by a pneumothorax not attributable to trauma or pleural gas-forming organisms. The majority of etiologies in Table 5 would qualify as fistulas.
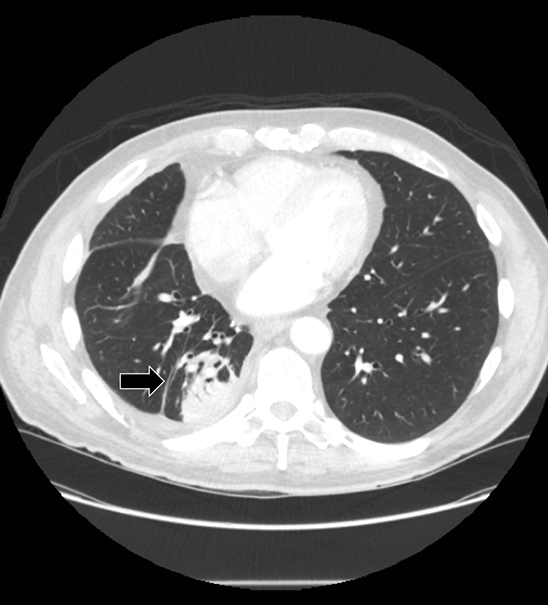
Studies have shown that modern multi-detector row CT scanners are able to detect central and peripheral fistulous tracts with comparable or superior sensitivity compared to bronchoscopy.29 If a fistula is not visible on imaging, one can be inferred in the appropriate setting, as in the case of cavitary squamous cell carcinoma with subsequent pneumothorax (Figure 18). The fallen lung sign deserves special mention, referring to bronchial rupture and subsequent collapse of the affected lung. Whereas a deflated lung in vivo should collapse centrally toward the hilum, the lung in this scenario “falls” with gravity, attached to the hilum only by its vasculature.30 The resultant pneumothorax would persist despite chest tube insertion. Rarely, fistulas to pleura have their origins outside of lung and airway. Figure 6 demonstrates a fistula from a pancreatic pseudocyst.
Lung entrapment and trapped lung
Lung entrapment and trapped lung share the findings of an unexpandable lung and therefore the failure of visceral and parietal pleura to adhere. However, lung entrapment requires active disease, such as malignancy or infection/inflammation while trapped lung is due to a fibrous peel from remote inflammation. In reality, the two probably represent diseases along different ends of the same spectrum. Nevertheless, the distinction is important because each portends differing management strategies.
Imaging findings in lung entrapment depend on the underlying disease process but often demonstrate complex pleural effusions (eg, nodules, loculation, thickening). Treatment is aimed at the underlying cause. Ex vacuo pneumothorax may be a consequence of thoracentesis or chest tube insertion. Trapped lung presents as pleural thickening and loculation without clinically active disease (Figure 20). Pleural calcification would support the suspicion of a remote process. The affected hemithorax is often reduced in size due to persistent negative pressures. The pleural effusion is remarkably constant in size over time and will rapidly re-accumulate with thoracentesis. Management is conservative.
Normal and abnormal appearance of the postoperative pleura/pleural space
Surgical management of pleural disease can take the form of open surgeries, which include decortication, pleurectomy, and extrapleural pneumonectomy, and minimally invasive video-assisted thoracic surgeries (VATS), which may involve pleurodesis.
Pleurectomy and decortication, or the removal of a fibrotic peel adherent to the visceral pleura, may be performed in cases where the peel precludes adequate re-expansion of the lung, as in lung entrapment. Post-surgical imaging findings include architectural distortion of lung and loculated pleural effusions (Figure 21).31 Long term drainage of an empyema may necessitate an Eloesser flap, a surgically created fistula between the skin and pleural space.32
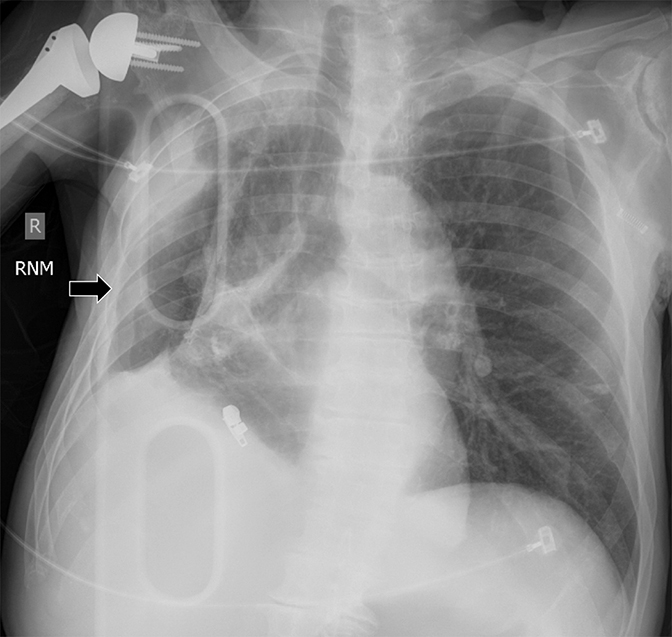
Pneumonectomy may take one of three forms: intrapleural, intrapericardial or extrapleural. Extrapleural pneumonectomy is indicated in some cases of malignant mesothelioma and tuberculous empyema and involves resection of lung and parietal pleura with prosthetic reconstruction. Typically, the post-pneumonectomy space fills completely with liquid between 3 weeks to 7 months. Complications in this space include bronchopleural and esophagopleural fistulae (such as from airway/esophageal injury or from stapler failure), cardiac herniation into space, hemothorax, empyema, and chylothorax. Decreasing liquid levels and new or increasing gas in the pneumonectomy space suggest BPF, with potential for liquid to escape into the tracheobronchial tree. Alternatively, a gas-forming organism may be considered. VATS and partial lung resection, in the form of lobectomy, segmentectomy, or wedge resection may lead to similar types of complications.
Conclusion
The pleura has a rather limited set of responses to pathology, namely effusion, pneumothorax, thickening, and elevated attenuation. Despite this redeeming quality, the assessment of pleural disease on imaging is fraught with vagaries and subtleties, and we intimate in our discussion that each type of response is not easily considered in isolation. For the radiologist, these challenges are an accepted part of daily interpretation, but only a good basic understanding of pleural pathology will keep us in good stead with the referring provider.
References
- Woodring JH. Recognition of pleural effusion on supine radiographs: how much fluid is required? AJR Am J Roentgenol. 1984;142(1):
- 59–64.
- Trackler R, Brinker RA. Widening of the left paravertebral pleural line on supine chest roetgenograms in free pleural effusions. AJR Am J Roentgenol. 1966;96(4):1027–1034.
- Parker MS, Chasen MH, Paul N. Radiologic signs in thoracic imaging: case-based review and self-assessment module. AJR Am J Roentgenol. 2009;192(3 Suppl):S34–48.
- Lewis P, McNulty N. In: Lewis P, McNulty N, eds. Oxford American Handbook of Radiology. New York, NY: Oxford University Press; 2013:75.
- Ruskin JA, Gurney JW, Thorsen KM, et al. Detection of pleural effusions on supine radiographs chest. AJR Am J Roentgenol. 1987;148(4):681–683.
- 6. Moy MP, Levsky JM, Berko NS, et al. A new, simple method for estimating pleural effusion size on CT scans. Chest. 2013;143(4):1054–1059.
- Abramowitz Y, Simanovsky N, Goldstein MS, et al. Pleural effusion: characterization with CT attenuation values and CT appearance. AJR Am J Roentgenol. 2009;192(3):618–623.
- Chapman SJ, Davies RJ. Recent advances in parapneumonic effusion and empyema. Curr Opin Pulm Med. 2004;10(4):299–304.
- Song J-W, Im J-G, Goo JM, et al. Pseudochylous pleural effusion with fat-fluid levels : report of six cases. Radiology. 2000;216(2):478–480.
- Matsumoto S, Kishikawa M, Hayakawa K, et al. A method to detect occult pneumothorax with chest radiography. Ann Emerg Med. 2011;57(4):378–381.
- Sabbar S, Nilles EJ. Images in clinical medicine. Deep sulcus sign. N Engl J Med. 2012;366(6):552.
- Wadhwa R, Ahmad Z, Kumar M. Delayed traumatic diaphragmatic hernia mimicking hydropneumothorax. Indian J Anaesth. 2014;58(2):
- 186–189.
- Engdahl O, Toft T, Boe J. Chest radiograph-a poor method for determining the size of a pneumothorax. Chest. 1993;103(1):26–29.
- Collins CD, Lopez A, Mathie A, et al. Quantification of pneumothorax size on chest radiographs using interpleural distances: regression analysis based on volume measurements from helical CT. AJR Am J Roentgenol. 1995;165(5):1127–1130.
- Chan S. Estimation of size of pneumothorax under the new BTS guidelines. Thorax. 2004;59(1):356.
- Kelly A-M, Druda D. Comparison of size classification of primary spontaneous pneumothorax by three international guidelines: a case for international consensus? Respir Med. 2008;102(12):1830–1832.
- Choi BG, Park SH, Yun EH, et al. Pneumothorax size: correlation of supine anteroposterior with erect posteroanterior chest radiographs. Radiology. 1998;209(2):567–569.
- Cugell DW, Kamp DW. Asbestos and the pleura. CHEST J. 2004;125(3):1103–1117.
- American Thoracic Society. Diagnosis and initial management of nonmalignant diseases related to asbestos. Am J Respir Crit Care Med. 2004;170(6):691–715..
- Jadczak P, Guz W, Kaznowska E, et al. Solitary fibrous tumour of the pleura - cases analysis. Pol J Radiol. 2014;79:368–373.
- Wignall OJ, Moskovic EC, Thway K, et al. Solitary fibrous tumors of the soft tissues: review of the imaging and clinical features with histopathologic correlation. AJR Am J Roentgenol. 2010;195(1):W55–62.
- Stathopoulos GT, Karamessini MT, Sotiriadi AE, et al. Rounded atelectasis of the lung. Respir Med. 2005;99(5):615–623.
- Dynes M, White EM, Fry W, et al. Imaging manifestations of pleural tumors. Radiographics. 1992;12(6):1191–1201.
- Leung a N, Müller NL, Miller RR. CT in differential diagnosis of diffuse pleural disease. AJR Am J Roentgenol. 1990;154(3):487–492.
- Sureka B, Thukral B, Mittal M. Radiological review of pleural tumors. Indian J Radiol Imaging. 2013;23(4):313–320.
- Imai K, Minamiya Y, Ishiyama K, et al. Use of CT to evaluate pleural invasion in non-small cell lung cancer: measurement of the ratio of the interface between tumor and neighboring structures to maximum tumor diameter. Radiology. 2013;267(2):619–626.
- Narayanaswamy S, Kamath S, Williams M. CT appearances of talc pleurodesis. Clin Radiol. 2007;62(3):233–237.
- Strzelczyk J, Holloway BJ, Pernicano PG, et al. Rolling stones in the pleural space: thoracoliths on CT, and a review of the literature. Clin Radiol. 2009;64(1):100–104.
- Seo H, Kim TJ, Jin KN, et al. Multi-detector row computed tomographic evaluation of bronchopleural fistula: correlation with clinical, bronchoscopic, and surgical findings. J Comput Assist Tomogr. 2010;34(1):13–18.
- Savas R, Alper H. Fallen lung sign: radiographic findings. Diagn Interv Radiol. 2008;14(3):120–121.
- Nachiappan A, Digumarthy S, Subba R, et al. An overview of lung surgeries: postoperative CT findings and complications. Internet J Radiol. 2009;12(1):1–14.
- Tsukada G, Stark P. Postpneumonectomy complications. AJR Am J Roentgenol. 1997;169(5):1363–1370.