Studies Examine CT Scans to Correlate Clinical Features with Mortality, Use SIRD Model to Predict COVID-19 Spread
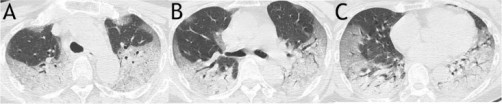
Figure 1. A sample scoring on CT images of a 63-year-old woman from mortality group demonstrated a total score of 63. It was calculated as: for upper zone (A), 3 (consolidation) × 3 (50–75% distribution) × 2 (both right and left lungs) + 2 (ground glass opacity) ×1 (< 25% distribution) × 2 (both right and left lungs); for middle zone (B), 3 (consolidation) × 2 (25–50% distribution) × 2 (both right and left lungs) + 2 (ground glass opacity) × 2 (25–50% distribution) × 2 (both right and left lungs); for lower zone (C), 3 (consolidation) × (2 (25–50% distribution of the right lung) + 3 (50–75% distribution of the left lung)) + 2 (ground glass opacity) × (2 (25–50% distribution of the right lung) + 1 (< 25% distribution of the left lung))
Two studies of the coronavirus COVID-19 outbreak were recently published in the open-access journal PLOS ONE.
The first study, published March 31, 2020, was conducted by Constantinos Siettos from the Universita degli Studi di Napoli Federico II, Italy and colleagues. The authors used a Susceptible-Infected-
The authors also used the SIRD model to estimate COVID-19’s R0 value, an estimate of contagiousness which reflects the average number of people who may catch an infection from one contagious person. Across various scenarios, their estimate of R0 based on the available data was around 2.5. Assuming a high degree of underreporting of mild cases of COVID-19 in their data, they estimated a mortality rate in the total population of around 0.15% for the virus. Furthermore, based on a scenario assuming an order of 20-fold scaling of the number of infected in the total population, their study predicted a decline of the outbreak at the end of February in Hubei. Indeed, during the last days the number of new infected cases has dropped significantly.
Dr Siettos notes: “This is the first study based on a mathematical modelling approach that has provided relatively accurate three- week-ahead forecasts. Importantly, to the best of our knowledge this is the first study based on a mathematical modelling approach suggesting that the actual number of the infections in the total population is of the order of twenty times more than those reported, and that the mortality rate in the total population is about ~0.15% i.e. significantly less than reported 2-3%.Our findings imply that for the case of Hubei (with a 60m population), around 2%-3% of the total population in Hubei has been actually infected by coronavirus.”
The second study, published March 19, 2020, was conducted by Mingli Yuan and colleagues from the Central Hospital of Wuhan, Hubei province, China. The researchers studied 27 patients infected with COVID-19 and admitted to the Central Hospital of Wuhan.
In this patient group, the authors associated clinical features identified from computed tomography (CT) scans of patients’ lungs with eventual outcomes. They scored patients based on features they observed such as ground glass opacity, abnormality on both sides, and widespread distribution of pathology in the lungs, to produce an overall severity score for each patient.
Of the 27 patients, who were mostly older adults (median age 60), 17 (63 percent) recovered and were discharged from hospital, while 10 (37 percent) died of the virus. Patients with underlying health conditions including hypertension, diabetes and cardiac disease were more likely to die of the virus than patients without such comorbidities, and older patients were also more likely to die, though there was no difference between genders. Patients with a higher (more severe) score at CT scan were much more likely to die of COVID-19 – the average score of patients who died was 30, compared to 12 in patients who recovered.
Dr Yuan adds: “This study allows us to compare radiologic findings with the mortality of patients infected with COVID-19.”
Citation: Anastassopoulou C, Russo L, Tsakris A, Siettos C (2020) Data-based analysis, modelling and forecasting of the COVID-19 outbreak. PLoS ONE 15(4): https://doi.org/10.1371/journal.pone.0230405
Funding: The authors received no specific funding for this work.
Competing interests: The authors have declared that no competing interests exist.
The article is available at: journals.plos.org/plosone/article?id=0.1371.0230405