Routine 3D imaging becomes a reality
Images
Radiologists are seeing advanced visualization (AV) from a whole new angle. Most rely largely on 2-dimensional (2D) images to make a diagnosis; however, innovation and ease-of-use are driving the adoption of 3D imaging. In fact, the quantitative attributes of AV technology have reached a new level of sophistication, prompting a paradigm shift in the delivery of patient information in which 3D imaging may lead to better patient care.
Adoption of 3D imaging grows
The use of AV originally emerged as a method for streamlining the analysis of large data sets from advanced imaging scanners in radiology departments.1 Today, AV has evolved from 3D applications commonly found on the modality workstations to 3D-specific workstations and now to enterprise advanced 3D imaging solutions that can be accessed from anywhere.2 With thin-clients and cloud computing now apart of the health care infrastructure, the AV sector in the United States (U.S.) has been forecast to grow at a compound annual growth rate of7% through 2014.1
“When I started as a radiologist, you couldn’t do a 3D volume routinely. Now we slice and dice sagittal and coronal views to make secondary captures daily at the workstation,” said Edward Zaragoza, MD, clinical director radiology IT, Acute Care Radiology Section Chief,UCLA Department of Radiology.
There are two key factors driving the expansion of AV in the clinical setting: continued acquisitions of computed tomography (CT) and magnetic resonance imaging (MRI) scanners, which often come bundled with AV software; and innovation.1 Innovation has made AV tools practical in the clinical setting, and the tools are sufficiently user-friendly that either a dedicated technician or the doctors themselves can reconstruct 3D images.
“A lot of it is technology driven, so the CT scanners started producing the sub-slice data, but the workstations weren’t powerful enough to handle all of those slices. Now the software has caught up, eliminating the barriers, and we are able to use AV routinely,” said Stephen Nash,a diagnostic radiologist at the Humber River Hospital in Toronto, Ontario, Canada.
Sophisticated qualitative analysis tools are also driving the adoption of AV software—particularly as a means to better communicate a diagnosis to the referring physicians.
At Sand Lake Imaging, a diagnostic imaging center in Orlando, FL, using quantitative data to present clinically relevant data to referring physicians is critical to providing better care. “Our belief is that to be streamlined and efficient, you need to deliver the information in a manner that is easily utilized by your referring doctors for preventive care,” said Stephen M. Bravo, MD, a diagnostic radiologist and one of the founders of Sand Lake Imaging. “The key to the future is preventive medicine and a more efficacious and streamlined approach to treating diseases and improving the quality with best-practice parameters. AV is going to allow us to jump into that discussion and really define disease states in are producible quantitative manner. Defining them will help prevent these diseases from progressing.”
He added, “It is a paradigm shift in the delivery of information for the benefit of the patient.”
Clinical workflow speeds up
Until now, limited processing power, isolated workstations, complicated user interfaces, and dependence on technologists to postprocess images have limited the use of AV to complex subspecialty cases, and have deterred its application in routine imaging.
“Many radiologists think advanced visualization capabilities are more routinely used for the isolated case than the typical cases. The reason 3D is not as prevalent has been because of the limitations of the technology up until now,” said Brad Levin, general manager, NorthAmerica, Visage Imaging.
A 2011 study2 by KLAS concluded that “radiology has not found a way to effectively work 3D imaging into the workflow of the radiology department.” Historically 2D and 3D imaging have been separated in the workflow process because the systems were not fast enough or not sufficiently robust to leverage large volume data sets, which led to the development of workflow on separate workstations. When the radiologist went to the dedicated 3D workstation, it was disruptive to his or her workflow, and it became more efficient to have the technologists reconstruct 3D and do advanced workups at a modality council or at the 3D lab, then forwarded secondary captures to the PACS.Meanwhile, the radiologist was limited to the 2D application on the PACS.
Fast forward to today and thin-clients and cloud computing have become robust enough to provide remote access to fully functional3D toolsets, enabling the radiologist to have both the 2D and 3D software on his or her individual workstation and to interact with the data in real time.
Sharing the workload
Building an efficient workflow varies depending on the volume of cases that are handled. At the UCLA Department of Radiology (UCLA), where it is not uncommon to read 4,000 slice studies in a single study, both the radiologists and dedicated radiological technologists perform 3D reconstruction.
To increase reader productivity, the radiologists in Dr. Zaragoza’s department have all of the 3D tools at their disposal from any location.To achieve this, UCLA implemented Visage 7 by Visage Imaging (San Diego, CA), which enables the department to read studies remotely and transfer data more quickly.
“Any time a doctor has to scroll and play with images and stop dictating, there’s potentially a loss of reader efficiency,” said Dr. Zaragoza.“The tool has to load cases almost instantaneously for us to maintain our speed efficiency.”
Visage 7 is designed for complicated casework, and actually speeds up the work substantially and gives improved access to the information. “In the PET application for Visage, if there’s a hotspot on the PET scan, you click on the hotspot and it automatically shows it to you in sagittal, axial, and coronal sections and CT and unfused and fused images. It will take you to the cause of that hotspot whether it’s an artifact or a small intrapulmonary lymph node. The ability to see a lung nodule and click on it to localize and see whether a lesion is metabolically active or not is a huge benefit,” Dr. Zaragoza said.Despite local bandwidth, the thin-client is very efficient in transporting data sets. “If you are trying to transfer images back and forth across a slower connection, then Visage has great usability because it has excellent compression characteristics for the images it is transmitting, whether they are film or complex 2D/3D images,” said Dr. Zaragoza. “It’s not sending the full bandwidth of the DICOM data set, it’s sending display data, which means in situations of limited bandwidth it gives best performance despite the ambient connectivity.”
An important part of the 3D workflow is performed by technologists in the 3D lab. “We still have a 3D lab with two full-time technologists whose job is to render 3D objects. For routine vascular work and some oncology work, intracranial aneurysms sculpted for neurosurgical intervention, we have standardized templates that technologist pre-renders for the surgeon. That is still a viable workflow,” said Dr. Zaragoza.With built-in templates and advances in artificial intelligence, technologists can almost always deliver the 3D images accurately and in the format the radiologist wants, saving the radiologist valuable time needed to evaluate the study. This is the philosophy at Sand Lake Imaging, Orlando, FL, which employs 3D volumetric reconstruction for all types of CT arteriography, including coronary arteriography, CTAs of the neck, of the brain, abdominal aorta and runoff vessels, and for delineating regions-of-interest for oncologic disease.
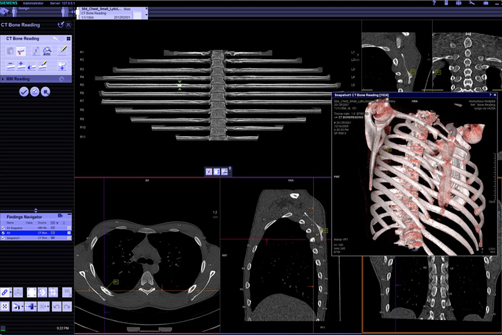
The imaging center recently implemented syngo.via by Siemens Healthcare (Malvern, PA) for its user-friendly and flexible interface designed to help accelerate workflows 3D routine and advanced readings (Figure 1). “Syngo.via has the tools which allow us to very easily identify, tag, and target all of those lymph nodes and then present them as both 3D models and as focal regional points of interest that can be delivered to the radiation oncologist in a manner that allows them to target those same 3-mm or 5-mm or 8-mm lymph nodes. My supposition is that it is going to improve the quality of medicine and improve survivability for these patients,” said Dr. Bravo.
“We were looking at ease-of-use and efficiency for technologists, how the final product presented by the technologist to the radiologist helped with radiology efficiency, and accuracy and reliability in terms of inter- and intraobserver variability and concordance in terms of how we graded stenosis or evaluated lymph nodes and patterns of atherosclerotic disease,” explained Dr. Bravo.
He added, “Our ability to deliver images rapidly and easily to our referring doctors in an interface that they understand and like has won over vascular surgeons and has increased our cardiac arteriography referrals.”
Radiologist do 3D in ‘real-time’
There is another school of thought among many radiologists who prefer to do 3D reconstruction in what they call ‘real-time.’ They would rather do it themselves than spend the time giving the technologist instructions on what measurements they want. This is the approach taken at The CardioVascular Center at Tufts Medical Center.
“I’m a big believer in real-time physician-directed image manipulation reconstruction. The person who knows what they want to see is sitting there at the time with the data set. It’s nearly impossible for a technologist to predict what I might want to be looking at when I sit down to read it. Not only do we the attending do the data sets but we teach the residents to be interactive with almost every study,” said Neil J. Halin, DO, FSIR, Chief, Cardiovascular-Interventional Radiology at Tufts Medical Center, Associate Director, Peripheral Vascular Group, The CardioVascular Center at Tufts Medical Center, and Assistant Professor of Radiology, Tufts University School of Medicine.
At Tufts’ integrated cardiovascular center, the physicians in interventional radiology, cardiology, cardiothoracic surgery, and vascular surgery use a large mix of resources for 3D reconstruction. “All of the doctors do the 3D reconstruction themselves. I do the aortic intergraph planning on a Advantage Windows by GE Healthcare (Waukesha, WI) workstation because its toolset is the easiest for the measurements we need to make,” said Dr. Halin.
The doctors perform cardiac MR with 4D and time-resolved MRAs on a Philips Healthcare (Amsterdam, The Netherlands) workstation,while an additional set of embedded 3D capabilities are available on the Carestream PACS. They use Visage 7, a thin-client AV platform byVisage Imaging for all cardiac CT studies.
“We didn’t want to be stuck to a workstation. The Visage system was one of the first thin-clients that can do cardiac. As a thin-client it can run anywhere and because it does server-side rendering, it will run on pretty much anything,” Dr. Halin said.For the transcatheter aortic valve replacement (TAVR) program at Tufts, cardiac 3D tools are used in the Carestream PACS. “On a real-time basis, we use the 3D that is integrated into our Carestream workstation, and it is a great workflow enhancement. I can use automatic slice registration and alignment. I don’t have to worry about synchronizing data, and I don’t have to go to another workstation. It doesn’tslow me down because it allows me to do what I need to do,” said Dr. Halin.
The same holds true for Dr. Nash and his colleagues at Humber River Hospital in Toronto, where a 3D lab is not available. Therefore, the radiologists perform 3D reconstruction themselves, including for routine cases.
“The traditional 3D workstations didn’t offer any advantage or capabilities on the routine CT bodywork, which is the vast majority of my practice. So I developed hanging protocols to utilize 3D reconstruction on every case, not just the subspecialty cases,” said Dr. Nash,who uses InteleSpace PACS by Philips Healthcare with AV for all 3D reconstruction at his hospital.
In the cardiac imaging program at Brigham & Women’s Hospital, Boston, MA, all of the radiology residents and cardiovascular imaging fellows do the reconstructions themselves, and learning Vitrea software (Vital Images, Minnetonka, MN) is a major part of their training.Frank J. Rybicki, MD, PhD, FAHA, FACR, Applied Imaging Science Laboratory, Brigham and Women’s Hospital (BWH), co-developed a set of guidelines for each type of examination and a large part the trainees’ responsibilities is to learn that software and to learn the proper way to do the reformation to the 3D volume rendering.
“Several visiting residents gravitate to my group because they want to learn these methods. Nevertheless, the BWH trainees are very happy to have that knowledge when they leave,” said Dr. Rybicki.
The radiologists at BWH use Vitrea where additional postprocessing is useful for a diagnosis or to display a pathology for the referring clinicians, but for cardiovascular cases they use Vitrea directly launched from the PACS.
“It does take additional time to do the reformations properly and to create the volumes, which are all archived on the PACS,” noted Dr.Rybicki. “But this time is well spent, especially when the follow-up scans come, and those volumes and reformats are already available to make comparisons—it simply becomes an integrated part of the workflow.”