The role of PET in the management of brain tumors
Dr. Spence is a Professor of Neurology, Dr. Mankoff is a Professor of Radiology, and Mr. Mark Muzi is a Research Scientist, University of Washington School of Medicine, Seattle, WA.
This article reviews clinical positron emission tomographic (PET) imaging of brain tumors, chiefly high- and low-grade gliomas, with emphasis on the use of fluorodeoxyglucose (FDG) for assessing energy metabolism and the use of [C-11]methionine (MET) for assessing amino acid transport. Additional tracers that are potentially applicable in management are briefly discussed.
The current standard noninvasive imaging procedures, computed tomography (CT) and magnetic resonance imaging (MRI), provide excellent anatomic precision and sensitivity. Unfortunately, treatment effects (including surgical trauma, corticosteroid-induced reduction of edema and contrast enhancement, and radionecrosis) cannot always be reliably distinguished from tumor response or recurrence. Because surgical tissue sampling in the brain carries significant risks, it is imperative to develop imaging methods that view tumors in their entirety and measure molecular pathologic processes as they progress over time. Positron emission tomography and MR spectroscopy add this capability to our clinical armamentarium.
There are several uses for PET: a) Grading tumors and estimating prognosis; b) Detecting tumor recurrence and distinguishing it from radionecrosis; c) Localizing the optimum biopsy site; d) Assessing response to therapy; and e) Defining target volumes for radiotherapy (RT).
Energy metabolism: [F-18]fluorodeoxyglucose
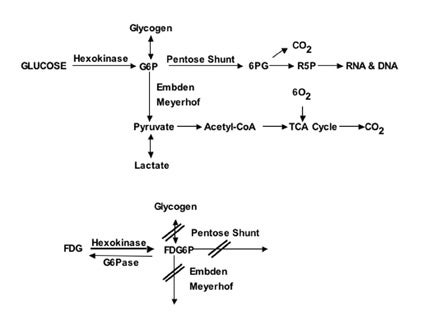
Glucose is the main source of energy in brain tumors 1 ; its metabolism begins with transport from the serum to cells and continues through the process of phosphorylation catalyzed by hexokinase (HK) (Figure 1). The product, glucose-6-phosphate (G6P), is the starting compound for glycogen synthesis, for the Embden-Meyerhof glycolytic pathway leading to lactate (glycolysis) or pyruvate and entry to the tricarboxylic acid cycle, and for the pentose shunt.
Positron emission tomography with FDG is based on the fact that FDG, similar to glucose, is transported across the blood-brain barrier (BBB) and cell membranes and then is phosphorylated by HK to FD-G6-phosphate (FDG6P), which accumlates in tissues at a rate proportional to the rate of glucose utilization (Figure 1). FDG6P is not metabolized further along the glucose metabolic pathways but is slowly dephosphorylated. FDG and glucose differ in their rates of transport and phosphorylation and respective volumes of distribution in brain or tumor tissue. As a result, FDG metabolism is thought to be proportional to but not quantitatively equal to glucose metabolism in brain tumors. 2
Grading and prognosis
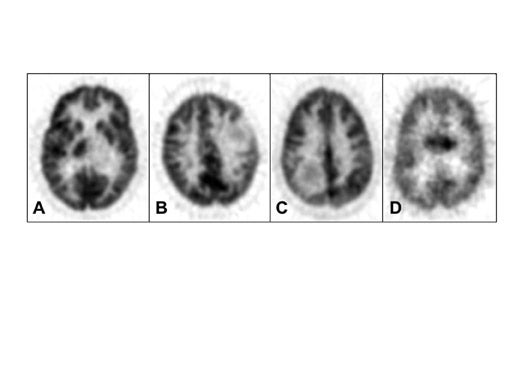
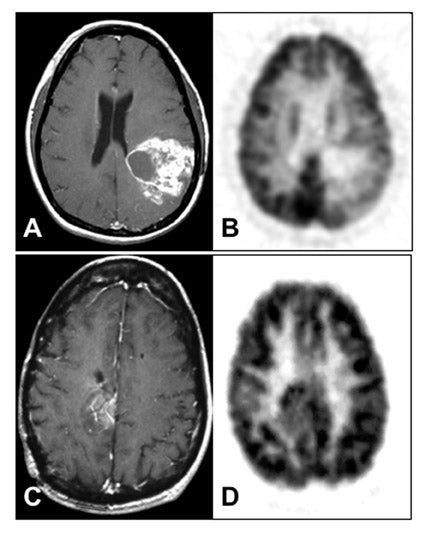
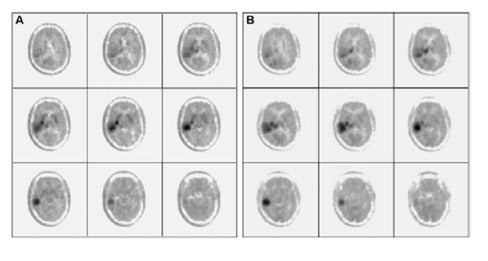
Di Chiro and coworkers pioneered the application of FDG-PET to gliomas. 3-5 High-grade gliomas contained regions of high FDG uptake and lower grade gliomas lacked these regions. Patients with grade III or IV astrocytic gliomas whose ratios of tumor to contralateral normal brain glucose utilization were greater than 1.4:1 had a median survival of 5 months, whereas patients whose ratios were less than 1.4:1 showed a median survival of 19 months. 6 In a similar study, tumor uptake of FDG greater than the cortex was associated with a median survival of about 10 months. 7 More recently, Padma et al 8 reported 331 cases assessed by tumor/reference region ratios: 0 = no uptake, 1 ≤ normal white matter (WM), 2 normal WM < lesion < normal cortex, and 3 ≥ normal cortex. In categories 0 and 1 combined, 86% of the tumors were grade I or II by pathology grading, with a median survival of 2.3 years. In categories II and III combined, 94% were grade III or IV, with a median survival of 11 months. Figure 2 shows examples with uptake reported as standard uptake value (SUV) as well as ratios of tumor/white matter (T/WM) and tumor/cortex (T/C). (Standard uptake value is calculated as tissue concentration of tracer/dose of injected tracer, usually normalized to body weight.)
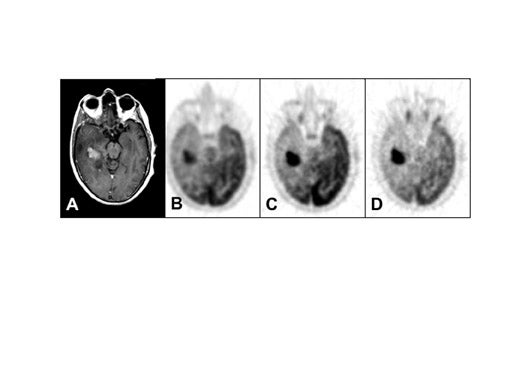
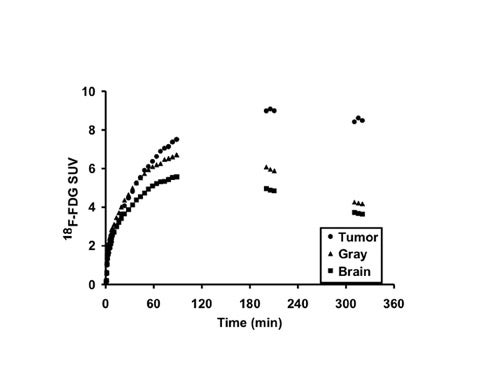
The optimal cutoff levels for distinguishing low- from high-grade gliomas have been reported as 0.6 for the T/C ratio and 1.5 for the T/WM ratio. 9 The sensitivity and specificity were 94% and 77%, respectively (Figure 2). In this study, patients were imaged 35 to 50 minutes postinjection. However, tumor/ reference region activity ratios estimated as SUVs steadily increase with time postinjection (Figures 3 and 4). 10 Therefore, the cutoff ratios of Delbeke et al 9 apply only to the imaging times that were used in their report.
On MRI or CT scans, gliomas that appear to be low-grade by lacking contrast enhancement present several diagnostic and management problems. Approximately 30% are malignant when surgically sampled. 11-14 For these cases, FDG-PET may well help estimate grade. This has been shown to be useful in biopsy-proven low-grade glioma in that FDG uptake in the tumor greater than white matter signifies a higher risk for progression and death than uptake equal to or less than white matter. 15
Localizing the optimal site for biopsy
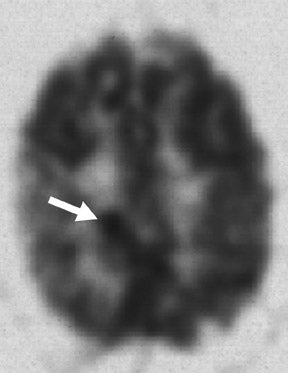
There are convincing data that support the practice of selecting biopsy sites in locations where the uptake of FDG is maximum; this helps to ensure sampling of the most malignant areas of tumors (Figure 5). 16-20
Radionecrosis versus recurrence
The sensitivity of FDG-PET for distinguishing recurrence of glioma from radionecrosis is typically 81% to 86%, although some reports are up to 100%. 21-28 Specificity is problematic in that estimates range from 22% to 100%. In the instructive report by Ricci et al, 28 there were 31 patients suspected of harboring a recurrence in whom the pathology was positive in 22 and negative in 9. With the cutoff of FDG uptake greater than white matter, the sensitivity was 86% but the specificity was only 22%. With the cutoff greater than cortex, the sensitivity was 73% and specificity 56% (Figure 6). The challenge of distinguishing recurrence from radionecrosis at the outset is beset with the problem that gliomas are ineradicable by all treatments that spare neurological function. Even though a high percentage of a given glioma after treatment may be necrotic as viewed by the pathologist or PET imager, the tumor may harbor viable cells that later lead to recurrence. Moreover, treated malignant gliomas wherein FDG-PET scans are hypometabolic (consistent with radionecrosis) may show, in biopsy or resection specimens, intact tumor cells that may or may not be capable of proliferation, energy metabolism, or substrate transport. 29
Assessing response to therapy
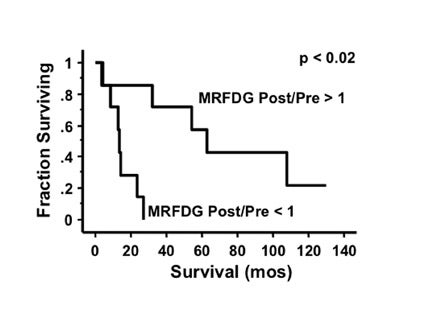
An important question in clinical practice is whether changes in glucose metabolism are a reliable predictor of the response of malignant gliomas to therapeutic interventions. Successful RT of a glioma would be expected to kill tumor cells and cause a reduction of the metabolic rate of FDG (MRFDG) as reported for chemohormonotherapy of breast cancer. 30 Stated as a hypothesis, tumors that respond to treatment show unchanged or reduced metabolism and, conversely, tumors that do not respond show increased metabolism. This has been tested in patients scanned quantitatively with FDG within 2 weeks before RT and/or 1 to 3 weeks after RT. 31 The results unexpectedly showed that an increase in MRFDG from the beginning of RT to the end correlated with longer survival while a decrease was associated with shorter survival (Figure 7). 32
Similar results, but involving chemotherapy, were reported for patients with recurrent glioblastoma studied with quantitative FDG-PET before and after a single cycle of 1, 3-bis-(2-chloroethyl)-1-nitrosourea (BCNU). 33 Following stereotactic radiosurgery (24 to 32 Gy) in a series of mostly metastatic tumors, Maruyama et al 34 reported that all of the tumors except 1 showed increased uptake of FDG compared with levels that preceded the RT. This correlated with a decrease in the size of the tumors that were seen at later follow-up with CT or MRI. Therapy might lead to increased metabolism and relatively better outcome because of increased transport, infiltration of dead and dying tumor regions with metabolically active inflammatory elements, energy consumption for apoptosis, and/or an uncrowding effect as tumor cells die, allowing more active metabolism in surviving normal elements.
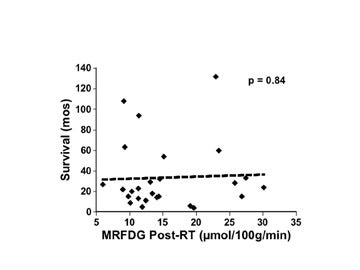
Another way to measure response to therapy is to assess metabolism at a single time following the intervention and hypothesize that longer survival correlates with lower metabolism. In 26 glioma cases from the study cited above, MRFDG measured shortly after RT did not correlate with survival (Figure 8). 31 Although no other studies have looked systematically and quantitatively at the immediate post-RT time to correlate metabolic rate with outcome, the measurement of the FDG uptake of malignant gliomas specifically at the time of clinical and/or radiographic recurrence has been proven to provide a significant predictor of survival. 35
Therapy planning
Gross and coworkers 36 incorporated FDG-PET results with MRI for delineation of the 3-dimensional 60 Gy treatment volumes for 18 high-grade gliomas. Their reported median survival of 44 weeks showed no improvement compared with survival rates reported in other studies. They concluded that FDG-PET did not add useful information for conventional treatment planning but suggested that it might prove useful to define a volume of tumor for a boost dose of RT. Such a study, in which FDG-PET was used to define the optimal volume for high-dose boost RT in glioblastoma, was, in fact, under way simultaneously. 37 Patients received 59.4 Gy in 33 fractions of conventional RT, followed by an additional 20 Gy in 10 fractions directed at the FDG-PET-defined volume of hypermetabolism plus a 0.5-cm margin. Although the median survival for the 40 patients in this trial was 70 weeks, this was not better than that of historical controls. Of interest, the FDG-avid volumes were predictive of survival and time to tumor progression in these patients. 38 This pilot study showed that experimental RT protocols based on PET imaging are feasible and, in the future, could be designed to target regions of hypoxia, proliferation, protein synthesis, or membrane biosynthesis. Other centers are beginning to explore the incorporation of FDG-PET targeting for a simultaneous integrated boost in intensity-modulated RT 39 and for planning radiosurgery target volumes. 40,41 These approaches will, of course, need to demonstrate efficacy before they will be widely applied in clinical practice.
In summary, for prognosis and grading preceding initial treatment or at recurrence, FDG-PET is clinically useful in that high uptake signifies more aggressive disease and shorter survival time. This pertains especially to tumors located in areas that are too dangerous for surgical sampling. FDG-PET may be used to direct biopsies to the most metabolically active foci in tumors. For assessing response with pre- to posttreatment comparisons, the usefulness of FDG-PET appears to be limited. Also, FDG-PET does not appear to be useful for assessing response to RT immediately after the treatment, which is when it would be most helpful to know whether the treatment succeeded or not.
Amino acid transport and incorporation: [C-11] methionine, O-(2-[F-18]fluoroethyl)-L-tyrosine, [F-18]fluorodopa
The original goal of PET imaging with labeled amino acids was to assess protein synthesis. 42 It is now recognized that the dominant process in the uptake of amino acid tracers is transport via the L system. 43-46 Intracellularly, amino acids for protein synthesis come either from the extracellular pool to which PET tracers contribute or from intracellular recycling of proteins. 47 As a result, PET with amino acids does not assess protein synthesis from endogenous recycling. 48 Depending on the particular amino acid, additional biochemical pathways lead in alternate directions for production of nonprotein biomolecules that cannot be distinguished from protein synthesis with PET. Therefore, estimating protein synthesis rates with PET and amino acid tracers is more complicated than quantification of glucose metabolism with FDG.
Amino acid uptake in normal brain tissue is low relative to FDG uptake so that the tumor to normal tissue contrast is better with amino acid imaging. Among several tracers, [C-11] MET has been the most widely reported. Unfortunately, synthesis of [C-11] MET requires a cyclotron on site, so it will likely not achieve widespread use in neuro-oncology. Interest is gaining in alternative and convenient F-18-containing amino acid tracers. O-(2-[18F] fluoroethyl)-L-tyrosine (FET) is one such alternative, but this is not metabolized so that images show transport exclusively. 49- 54 Another is [F-18]fluorodopa, which compared favorably with MET in a recent study (Figure 9). 55
The uptake of MET in lesions lacking breakdown of the BBB suggests that there is upregulation of the transport process across the capillary wall. 56 The extent of tumor delineated by MET for glioblastoma is larger than the area defined by gadolinium with MRI but is smaller than the T2-defined area, although in most cases the MET area extends partly beyond the T2 volume. 57 The distribution of methionine through several biosynthetic processes, including phospholipid synthesis, provides a broad measure of tumor growth. Proliferating cell nuclear antigen staining of histology specimens to assess proliferation correlated with MET uptake in 1 study. 58 In another study, uptake of MET correlated with microvessel density, which is consistent with the current understanding that uptake is predominantly increased transport, a process that involves both permeability and capillary wall surface area. 59 However, the same authors did not find an association of MET uptake with endothelial proliferation of high-grade astrocytomas. 60
Detection
In a report of 50 cases, PET with MET (MET-PET) showed accumulation in 31 of 32 high-grade gliomas (97% sensitivity) and 11 of 18 low-grade gliomas (61%). 61 Kracht et al 60 reported a sensitivity of 87% and a specificity of 89% for detection of tumor tissue by stereotactic biopsy guided by MET uptake at a threshold of 1.3 relative to normal brain tissue. The usefulness of MET-PET for the detection of gliomas that are hypo- or isometabolic on FDG-PET has been shown by Chung et al. 62 Eight of 10 le-sions that lacked detectable FDG uptake were detected by MET-PET. Imaging with MET correctly distinguished gliomas from nontumoral lesions in 79% of cases when a threshold ratio of 1.47 was used to compare tumor to contralateral reference brain activity. 44
Compared with MET, studies with the nonmetabolized tyrosine (FET), produce similar results. 53 For this tracer, the sensitivity and specificity are both 88% for detecting glioma in cases suspected of having this pathology based on MR imaging. 49 However, another group has reported that the capacity of FET to distinguish tumor tissue from nontumor tissue is limited. 54 MRI and FET-PET can be used together with neuronavigated biopsies to improve the diagnostic accuracy of suspected gliomas. 51 The sensitivity and specificity of MRI alone were 96% and 53%, respectively, whereas with MRI and FET-PET combined, the results were 93% and 94%.
Grading and prognosis
In an early study of 22 patients with gliomas, MET uptake was measured by a ratio of uptake in tumor to uptake in contralateral healthy brain, and this was correlated with pathology grade. 63 For grade II gliomas (n = 5) the ratio was 1.0, grade III (n = 5) 1.7, and grade IV (n = 12) 2.3. Despite the small numbers, the difference between II and III, and II and IV reached significance but not the difference between III and IV. Another report showed that tumor-to-mean cortical uptake <2.1 was associated with survival >5 years, whereas >2.1 was associated with survival of 8 months. 64 Interestingly, MET uptake has been found to be greater in grade III oligodendroglioma than grade III astrocytoma, although the prognosis is generally better for oligodendroglial than for astrocytic tumors. 65 In grade II lesions, MET uptake was greater in untreated oligodendro-glioma than in astrocytoma or oligoastrocytoma. 44 In contrast to MET, the tracer FET has shown limited usefulness for distinguishing low- from high-grade gliomas at onset or at recurrence. 49,52,54
Which tracer-FDG or MET-is a better prognostic marker in glioma cases? Kim et al 66 assessed this in 47 patients and claimed that MET is better. They found that MET uptake--but not FDG uptake--relative to gray matter correlated with proliferation index assessments. If the uptake measurements had been relative to contralateral white matter rather than gray matter, FDG may well have compared better. Many other studies have confirmed the prognostic value of FDG with which this study did not agree 3-6,8,9,31 even in comparison to MET-PET. 64
Deoxyribonucleic acid biosynthesis: 2-[C-11]thymidine, [F-18]3'deoxy-3'-fluorothymidine
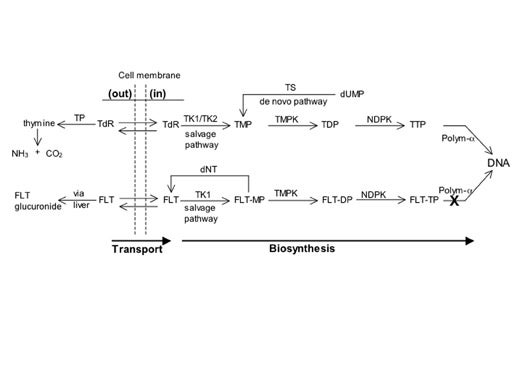
The S-phase fraction in glioblastoma averages about 8%, in anaplastic astrocytoma 4%, in low-grade glioma 1% to 2%, and in normal brain at or close to zero. 67,68 Consequently, tracers of deoxyribonucleic acid (DNA) synthesis such as 2-[C-11]thymidine (TdR) or [F-18]3' deoxy-3'-fluorothymidine (FLT) may provide high contrast between tumor and normal brain in proportion to the grade and proliferation rate. 69-73 However, limited exchange of TdR or FLT across the BBB makes transport a potentially rate-limiting step in brain tumor imaging. 74,75
The metabolic pathways followed by TdR and FLT are illustrated in Figure 10. Circulating TdR or FLT is taken up and phosphorylated intracellularly via the salvage pathway. 2-[C-11]thymidine, but not FLT, becomes incorporated into DNA. 69 For TdR, the rate-limiting steps are the initial phosphorylation catalyzed by thymidine kinase-1 (TK1) and the incorporation of thymidine triphosphate (TTP) into DNA, the latter step being the one that determines TdR retention in somatic tumors and probably in brain tumors as well. 75,76 In contrast, for FLT, the initial phosphorylation by TK1 is the rate-limiting step for retention in somatic tumors. 77 Phosphorylation by TK1 and incorporation into DNA are linked in most situations, 69 and TK1 is upregulated several-fold as cells pass from the G1 phase to the S phase of the cell cycle. 78
The production of thymidine mono-phosphate (TMP) via the salvage route supplements de novo synthesis from intracellular deoxyuridine such that the rate of uptake of exogenous TdR or FLT is affected by the relative utilization of the salvage versus de novo pathways. 69,79 Tumors wherein the de novo pathway dominates DNA synthesis may be poorly imaged with PET tracers that are limited to following the salvage pathway. 80
Thymidine labeled with C-11 in either the methyl or 2-position provided the first PET tracers for imaging cellular proliferation. 81-86 Their use has been validated in gliomas, but the necessity for dynamic imaging, metabolite analysis, and mathematical modeling prevents their routine use in clinical practice. 75,87
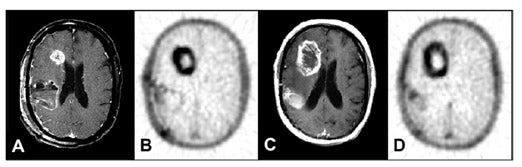
[Fluorine-18]3'deoxy-3'-fluorothymidine is a longer-lived and more convenient alternative that is resistant to degradation, thereby eliminating the background of labeled metabolites in the images. 88-90 Sloan and coworkers 91-93 reported findings in 29 patients with gliomas at presentation or recurrence and found little FLT uptake in normal brain and greater levels of uptake the higher the tumor grade. Uptake in areas of radionecrosis was low. Similar results were recently reported by Choi et al 94 in a heterogeneous group of 26 lesions, but it is noteworthy that they found increased FLT uptake in 1 case each of radionecrosis, subacute infarction, and multiple sclerosis. Compared with FDG, FLT was found by another group to be more sensitive for imaging recurrent high-grade gliomas, proved to be a more powerful predictor of tumor progression and survival, and correlated better with Ki-67 estimates of proliferation. 95 One important common finding in these studies was that tumors lacking contrast enhancement in MRI images did not have detectable uptake of FLT.
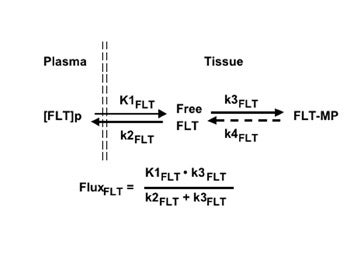
Mathematical modeling that describes the uptake of FLT is simpler than that for TdR (Figure 11), since the only plasma metabolite is the glucuronide (Figure 10). Retention of FLT is reflected in the flux constant, K FLT , and transport in K 1FLT :
Flux = K FLT = K 1FLT • k 3FLT /(k 2FLT + k 3FLT ).
Quantitative imaging based on this model, arterial blood sampling, and simple metabolite analysis provide more information than simple SUV assessment, since transport and flux can be simultaneously estimated. 77,96 An example from our preliminary work is illustrated in Figure 97,98 The FLT-PET images clearly show an additional dimension to assessing response to therapy that is achievable by this approach. In agreement with the above studies, we have been unable to show any FLT uptake in the absence of breakdown of the BBB in low-grade gliomas or in regions of high-grade gliomas without BBB breakdown. In all cases, uptake of FLT has been dominated by transport.
Hypoxia: [F-18]fluoromisonidazole
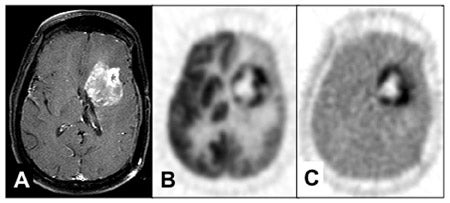
In several types of cancers, low-oxygen- tension levels are associated with resistance to RT and chemotherapy, persistent tumor following RT, and subsequent development of local recurrences. 99-102 Malignant gliomas often contain regions of hypoxia. 103-105 The tracer [F-18]fluoromisonidazole (FMISO), when used with PET, provides an estimate of the distribution of hypoxia in tumors. 106-109 This tracer is sufficiently lipophilic that it diffuses through cell membranes and is not retained in nonhypoxic tissues, such as the brain. Liu et al 110 reported that FMISO was taken up in 14 of 18 brain tumors and Bruehlmeier et al 111 found increased uptake in 7 of 7 glioblastomas. Another group studied 13 newly diagnosed patients prior to surgery and showed a correlation between FMISO uptake and tumor grade; all high-grade lesions showed uptake that was frequently heterogenous. 112 An example shown in Figure 13 shows the heterogenous uptake of FMISO in a distribution that differs partially from the FDG region in these coregistered images. These studies show significant promise for FMISO-PET in gliomas, but research must be extended to a larger patient population that is examined at additional time points through the clinical course. Identifying the regional distribution of hypoxia may improve planning of resections and allow the targeting of higher doses of RT more precisely to the hypoxic areas.
Conclusion
Energy metabolism and amino acid transport are important components of the pathophysiology of brain tumors about which PET provides information that is clinically useful. Imaging proliferation with FLT or hypoxia with FMISO is straightforward, although neither tracer has yet been exploited thoroughly enough to allow judgment of the potential benefit to the practice of neuro-oncology.
Future directions
Measuring membrane biosynthesis with PET and 1-[C-11]acetate or a choline tracer may yield information about tumor growth as helpful as DNA synthesis. 110,113-120 New doors are beginning to open in molecular imaging as novel tracers are being developed for assessing the epidermal growth factor receptor, angiogenesis, apoptosis, and gene expression. 121-124