Stroke differential diagnosis and mimics: Part 2
Images


Editor’s note: This is the second part of a 2-part article. The first part was published in the November 2015 print issue of Applied Radiology.
In Part 1, the authors reviewed the typical imaging features of ischemic stroke at different ages and considered numerous pathologies that can mimic ischemic stroke such as seizure, migraines, tumors, and toxic-metabolic abnormalities. The MR characteristics of ischemic stroke were compared to imaging mimics based on six patterns to topographic distribution
In this second part, further anatomic localizations of ischemic stroke versus non-ischemic pathology with similar MRI appearances are reviewed. These include white matter distribution, such as multiple sclerosis, scattered punctate foci of abnormality including cardiac emboli or vasculitis leading to stroke versus mimics as diffuse axonal injury or fat-emboli, and a border zone pattern including watershed infarcts versus Posterior Reversible Encephalopathy Syndrome (PRES) as one mimic.
Many of the pathologies simulating ischemic infarction also demonstrate restricted diffusion as occurs with hypoglycemia, carbon monoxide poisoning, and early stages of herpes simplex encephalitis., which makes the differentiation from ischemic infarct even more difficult.
White matter abnormality
CADASIL
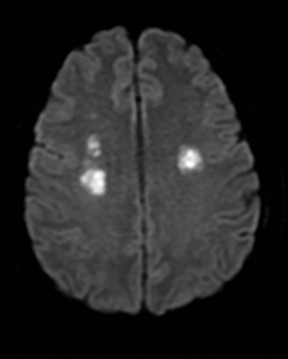
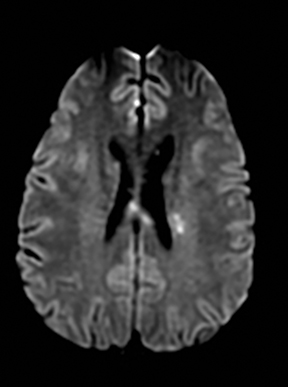
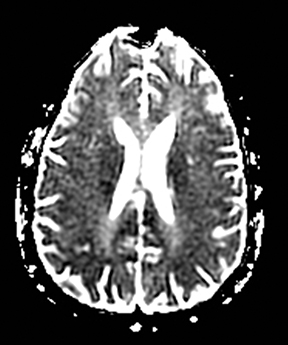
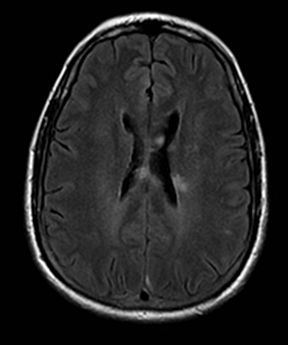
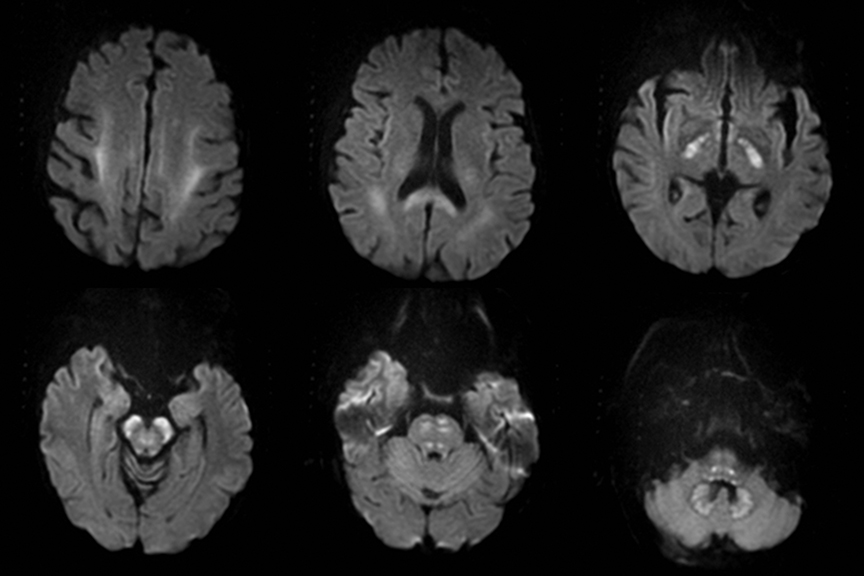
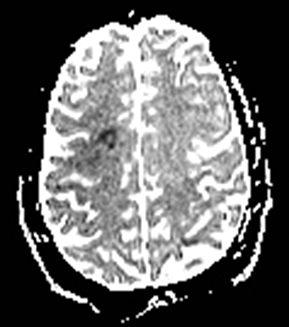
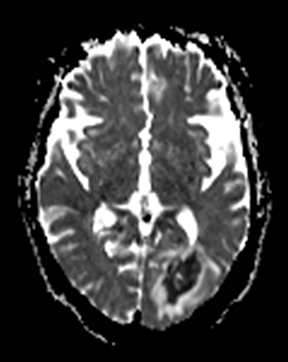
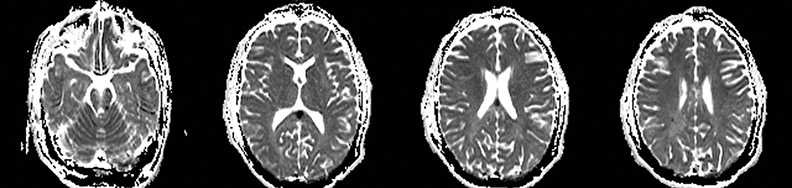
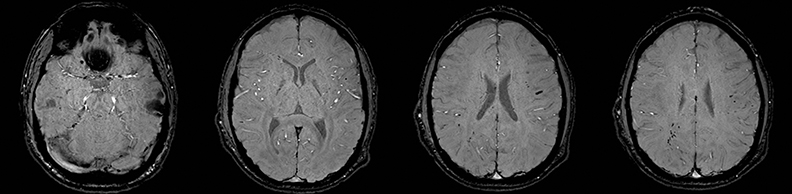
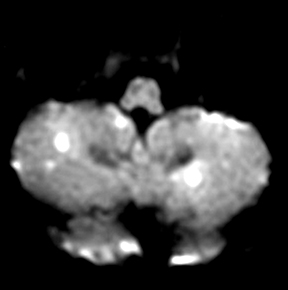
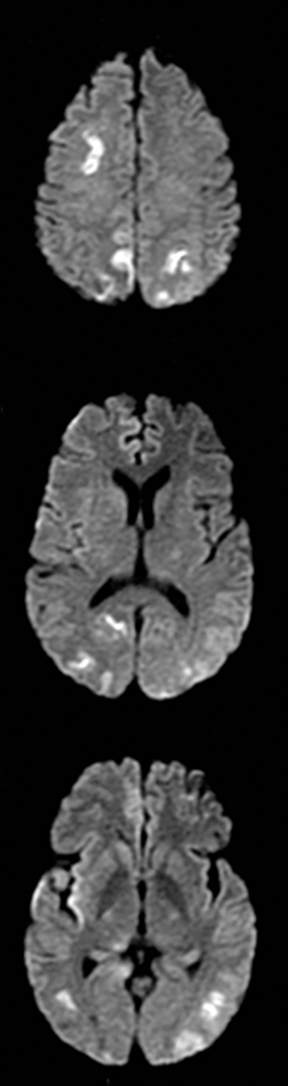
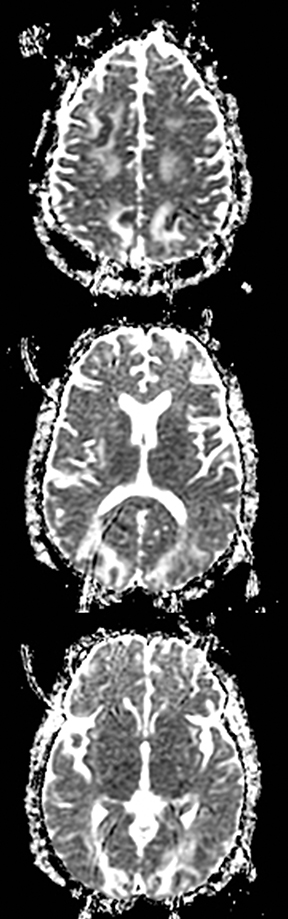
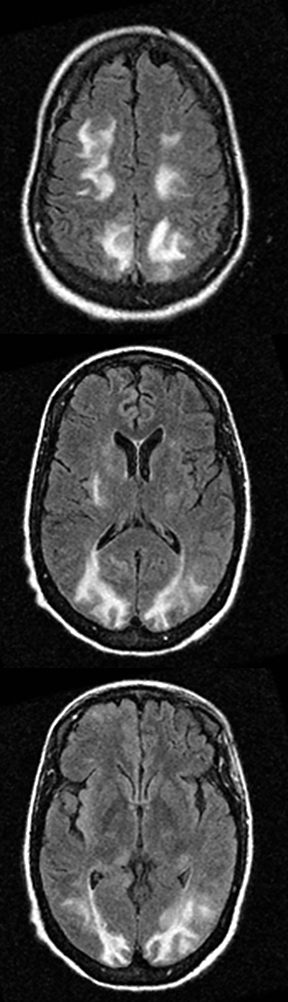
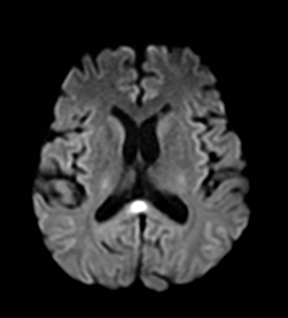
Cerebral autosomal dominant arteriopathy with subcortical infarcts and leukoencephalopathy (CADASIL) is an inherited disease that affects smooth muscles of the penetrating cerebral and leptomeningeal arteries. The symptoms usually start in the third or fourth decades with migraine headaches, TIA and ischemic strokes. In later decades, they develop dementia. MRI reveals confluent patchy supratentorial white matter T2 hyperintensities and lacunar infarcts in deep gray matter, midbrain and pons. 133-136 The hallmark of CADASIL is involvement of bilateral anterior temporal white matter and external capsules. Acute lesions demonstrate restricted diffusion (Figure 16).
Susac’s syndrome
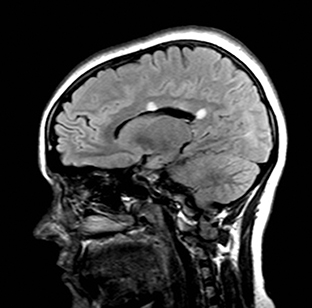
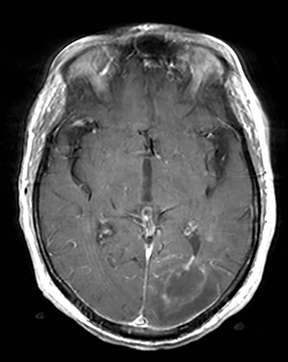
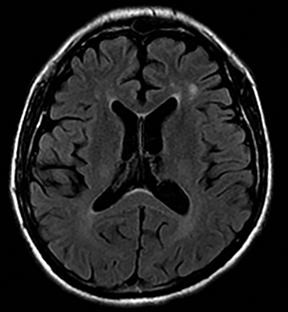
Susac’s syndrome is rare and involves small vessels of the brain, retina and inner ear and presents with focal neurologic deficits as well as visual and hearing loss. Mean age of onset is 32 years and it is more common in women.137 Numerous small T2 hyperintense foci are seen in the supratentorial white matter, corpus callosum, and less often the deep gray matter.138 Acute lesions demonstrate restricted diffusion and in approximately 50% enhance (Figure 17).138 Susac’s syndrome can be mistaken for multiple sclerosis due to a similar pattern of white matter involvement.137 One difference is that the callosal lesions associated with Susac’s syndrome tend to involve the full thickness of the corpus callosum while those associated with multiple sclerosis tend to involve only the inferior surface of the corpus callosum. In addition, approximately 25% of cases demonstrate leptomeningeal enhancement which is not seen with multiple sclerosis.
Metronidazole toxicity
Metronidazole is usually used for treatment of anaerobic infections and for preventing recurrence in Crohn’s disease. It is generally safe, but it rarely may result in peripheral neuropathies and central neurotoxicity at dosages more than 2 g/day when used for prolonged periods.139,140 Central neurotoxicity is characterized by symmetric bilateral T2 hyperintensity in dentate nuclei, midbrain, corpus callosum, pons, medulla, and subcortical cerebral white matter and basal ganglia in decreasing order. The gray matter lesions are associated with vasogenic edema and are typically reversible, but the white matter lesions are associated with low ADC due to cytotoxic edema (Figure 18) and may be irreversible. The mechanism of metronidazole induced neurotoxicity is not clear. It is suggested that the conversion of metronidazole to a thiamine analog which inhibits thiamine pyrophosphokinase and malabsorption may play role in metronidazole induced toxicity.141-144
Methotrexate toxicity
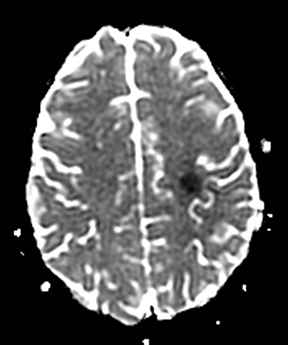
Methotrexate neurotoxicity occurs in 1 to 3% of treated patients, especially after administration of intrathecal or intermediate and high doses of intravenous or oral methotrexate145 and can be acute, subacute or chronic. The subacute form occurs within 5–14 days and may mimic stroke or TIA, but generally symptoms completely resolve within days. Patients present with seizures and neurologic deficits such as aphasia, hemiparesis and ataxia. The MRI findings include transient restricted diffusion and/or T2 hyperintensity in the periventricular white matter, particularly the corona radiata and centrum semiovale (Figure 19). The mechanism of restricted diffusion in methotrexate induced subacute encephalopathy may be related to excitotoxic injury rather than demyelination.146-148
Heroin leukoencephalopathy
Heroin leukoencephalopathy is caused by inhalation of heroin vapors, a practice known by a Chinese phrase “chasing the dragon” and has a mortality rate of 23%. MRI findings are pathognomic and include symmetric and confluent bilateral T2-hyperintensity within the cerebral and cerebellar white matter and posterior limbs of internal capsules. There is a predilection for parieto-occipital white matter. The subcortical U fibers, dentate nuclei and anterior limbs of internal capsules are preserved. Restricted diffusion in the acute phase correlates with initial development of small vacuoles within the myelin lamellae.16,149-151 In sub-acute and chronic stages, these vacuoles become larger and coalesce, resulting in increased diffusibility of water molecules.16,150
Multiple sclerosis
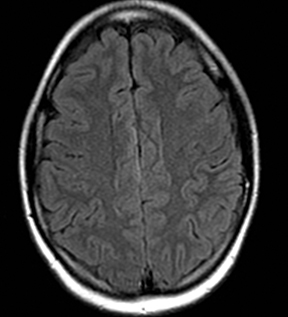
Multiple sclerosis may present with sudden-onset focal neurologic deficits such as aphasia or hemiplegia.152,153 The typical MRI findings are T2 hyperintense lesions in the periventricular, deep and juxtacortical white matter. Acute lesions are usually associated with increased diffusion, but they may occasionally show transient (2–7 days) restricted diffusion (Figure 20). The restricted diffusion is characteristically seen in the periphery of the lesions, but may be central. These lesions are most often associated with contrast enhancement similar to subacute stroke, indicating active inflammation.154,155 Cytotoxic edema due to excitotoxic injury to oligodendrocytes, myelin sheaths and axons has been proposed as the cause of restricted diffusion in multiple sclerosis.156-158
Infectious cerebritis and abscess
Clinically cerebritis or brain abscess may be mistaken as stroke. Early cerebritis may present with an ill-defined T2-hyperintense lesion with restricted diffusion and minimal or absent contrast enhancement (Figure 21).159,160 Bacterial abscesses usually have a well-defined enhancing rim with central restricted diffusion and surrounding edema, an appearance that can be seen but is unusual for late subacute stroke. However, fungal abscesses may have a less well defined rim and are more likely to be confused with stroke. The cause for restricted diffusion in pyogenic brain abscess is attributed to restricted water diffusion in purulent fluid.161 Decreased diffusion in case of cerebritis may be related to cytotoxic edema due to necrotizing angiitis or venous thrombosis. 159,160
Scattered punctate foci
Strokes
Cardioembolic sources are the most common cause, but other etiologies such as vasculitides can produce a similar pattern.162
Diffuse axonal injury
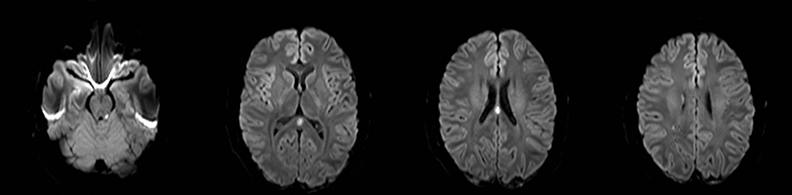
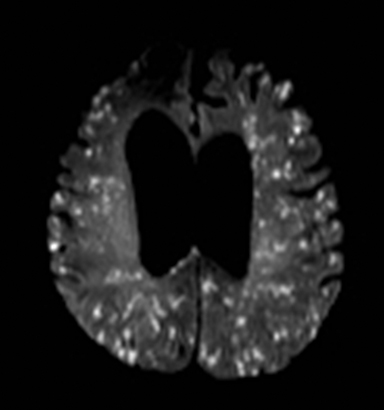
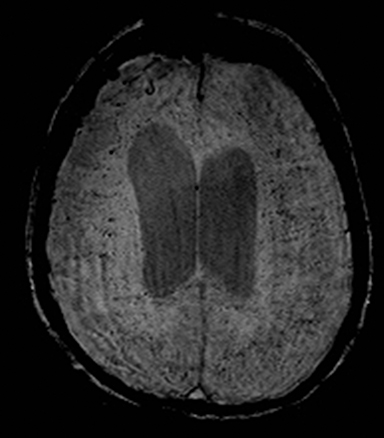
Diffuse axonal injury (DAI) is a widespread disruption of the axons caused by abrupt acceleration, deceleration or rotational injury in severe head trauma.163 FLAIR shows multiple small lesions in the gray-white matter junction, corpus callosum, fornix, along the cerebral white matter tracts, and the dorsolateral brainstem (Figure 22).163,164 Many of these lesions also have restricted diffusion, with a variable time course that may persist for days or weeks. The restricted diffusion may be due to ischemia related to traumatic microvascular injury, swelling of the retracted axons or Wallerian degeneration of crossing interhemispheric fibers.165 T2*-weighted GRE images demonstrate additional lesions that are hemorrhagic.166
Fat emboli
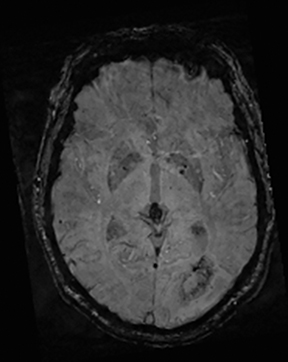
Fat embolism typically occurs in the setting of a recent long bone fracture, orthopedic procedures or bone marrow infarction in sickle cell disease.167 It usually presents with hypoxia, confusion, neurologic deficits, and petechial rash. MRI shows numerous punctate foci of restricted diffusion throughout the brain.168 The release of fatty acids results in endothelial injury and microhemorrhages which manifest as numerous punctate foci of susceptibility, far more than would be expected for thrombo-embolic infarcts (Figure 23).169,170
Metastases
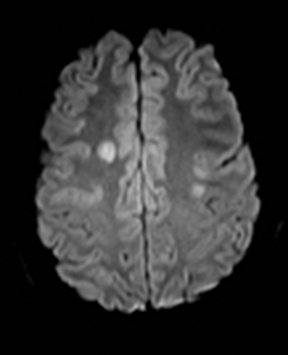
Highly cellular metastases, especially small-cell lung carcinoma can show restricted diffusion due to dense cell packing and be confused with acute or subacute embolic strokes (Figure 24). Some distinguishing features are presence of surrounding vasogenic edema, peripheral enhancement and additional extraparenchymal disease (such as calvarial lesions).
Border zone pattern
Border zone infarction
Border zone infarctions are defined as ischemia between two major cerebral arterial territories and it occurs due to hypotension in patients with severe carotid stenosis, Moya-moya disease, and reversible cerebral vasoconstriction syndrome.171,172 Posterior reversible encephalopathy syndrome (PRES) and cerebral hyperperfusion syndrome are among mimics.
Moya-moya disease
Moya-moya disease is characterized by idiopathic, chronic and progressive stenosis of distal internal carotid and proximal anterior and middle cerebral arteries, with formation of vascular collateral networks similar to a “puff of smoke” (or “moya-moya” in Japanese). A number of conditions can cause a moya-moya-like appearance, including radiation, neurofibromatosis type 1, Down syndrome, sickle cell disease, trauma, and slowly progressive atherosclerosis. Infarctions typically occur in an anterior circulation border zone or basal ganglia distribution. Cerebral hemorrhage into the basal ganglia also occurs due to the fragility of lenticulostriate vessels.
Reversible cerebral vasoconstriction syndrome (RCVS)
RCVS is a poorly understood disease characterized by vasospasm not due to subarachnoid hemorrhage or trauma. Patients usually present with acute or recurrent severe “thunderclap” headaches, often with focal neurologic deficits. Resolution of the vasospasm over a period of weeks to three months confirms the diagnosis.173,174 About half of the patients develop ischemic stroke, usually in a border zone pattern.173,175 Intracranial hemorrhage (parenchymal or subarachnoid) and PRES-like edema can be seen in up to one third of the patients. 173,176
Posterior reversible encephalopathy syndrome (PRES)
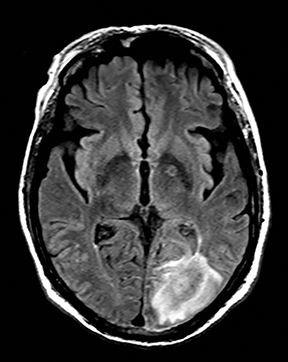
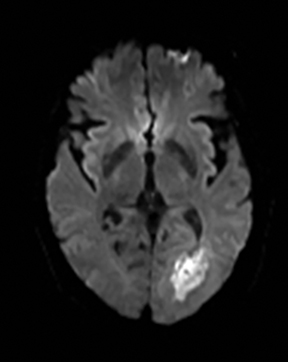
Posterior reversible encephalopathy syndrome (PRES) is characterized by vasogenic cerebral edema due to loss of vascular autoregulation and capillary leakage177 and mimics late subacute stroke. Patients typically present with headaches, cortical visual symptoms, seizures, and confusion.177 It can be triggered by hypertension, eclampsia/pre-eclampsia, critical medical illness, and immunosuppressants.177,178 Imaging typically demonstrates T2-FLAIR hyperintensity with elevated diffusion in the bilateral occipital and parietal lobes (mimicking posterior circulation infarctions) and/or in a borderzone distribution between the anterior and middle cerebral arteries (mimicking borderzone infarctions).179-181 Restricted diffusion, due to cytotoxic edema, is present in 10–25% patients and portends a worse outcome (Figure 25).181-183 Intraparenchymal hemorrhage is seen in 15% of cases.
Hyperperfusion syndrome
Hyperperfusion syndrome occurs after carotid endarterectomy in 1-3% cases, likely due to impaired cerebral autoregulation. It presents with triad of headache, seizures and neurological deficits. It is typically characterized by vasogenic edema with elevated diffusion in the borderzone between the anterior and middle cerebral arteries and increased cerebral blood flow. The time course and seizures help differentiate the condition from late subacute infarction.184
Splenial lesions
Splenial lesions can be seen in many conditions (Figure 1), either as an isolated lesion or as part of a more widespread distribution pattern.
Antiepileptic drug treatment or withdrawal
A number of antiepileptic medications are associated with asymptomatic restricted diffusion in the splenium (Figure 26).185 These lesions resolve even with continuation of treatment and are seen in patients on monotherapy with phenytoin, carbamazepine, oxcarbazepine, lamotrigine, vigabatrin, valproate and phenobarbital.185
Marchiafava–Bignami disease
Marchiafava-Bignami disease is a rare disease that occurs mostly in alcoholic men with malnutrition. Symptoms range from psychiatric disturbances, hemiparesis, aphasia and seizures to sudden onset of coma. The body of the corpus callosum, genu and then splenium or the entire corpus callosum are involved in a decreasing order.186 The lesions are typically T2 hyperintense and may show restricted diffusion.187
Radiation therapy
Focal T2-FLAIR hyperintense signal in the splenium of the corpus callosum is a common finding after brain radiation therapy188 and can be associated with restricted diffusion. It has been proposed that the splenium is more sensitive to radiation induced changes and the pathogenesis of these alterations is likely related to an indolent process, possibly demyelination.188
Conclusion
Stroke mimics are common in the emergency department and some of these patients may be treated with intravenous tPA. Despite many clinical and imaging overlaps, a pattern-based approach provides a reasonably accurate method to diagnose of many of these conditions and facilitate appropriate and timely management.
Part 1 of this article was published in print in Applied Radiology, Volume 4, Issue 11 and is available online at appliedradiology.com
References
- van den Boom R, Lesnik Oberstein SA, Ferrari MD, Haan J, van Buchem MA. Cerebral autosomal dominant arteriopathy with subcortical infarcts and leukoencephalopathy: MR imaging findings at different ages—3rd-6th decades. Radiology. 2003;229:683-690.
- Singhal S, Rich P, Markus HS. The spatial distribution of MR imaging abnormalities in cerebral autosomal dominant arteriopathy with subcortical infarcts and leukoencephalopa thy and their relationship to age and clinical features. AJNR Am J Neuroradiol. 2005;26:2481-2487.
- Nozaki H, Sekine Y, Fukutake T, Nishimoto Y, Shimoe Y, Shirata A, et al. Characteristic features and progression of abnormalities on MRI for carasil. Neurology. 2015;85:459-463.
- Lee YC, Liu CS, Chang MH, Lin KP, Fuh JL, Lu YC, et al. Population-specific spectrum of notch3 mutations, MRI features and founder effect of cadasil in chinese. J Neurol. 2009;256:249-255.
- Dorr J, Ringelstein M, Duning T, Kleffner I. Update on susac syndrome: New insights in brain and retinal imaging and treatment options. J Alzheimer’s Dis. 2014.
- White ML, Zhang Y, Smoker WR. Evolution of lesions in susac syndrome at serial MR imaging with diffusion-weighted imaging and apparent diffusion coefficient values. AJNR Am J Neuroradiol. 2004;25:706-713.
- Frytak S, Moertel CH, Childs DS. Neurologic toxicity associated with high-dose metronidazole therapy. Ann Int Med.. 1978;88:361-362.
- Snavely SR, Hodges GR. The neurotoxicity of antibacterial agents. Ann Int Med.. 1984;101:92-104.
- Kim E, Na DG, Kim EY, Kim JH, Son KR, Chang KH. MR imaging of metronidazole-induced encephalopathy: Lesion distribution and diffusion-weighted imaging findings. AJNR Am J Neuroradiol. 2007;28:1652-1658.
- Zuccoli G, Pipitone N, Santa Cruz D. Metronidazole-induced and wernicke encephalopathy: Two different entities sharing the same metabolic pathway? AJNR Am J Neuroradiol. 2008;29:E84; author reply E85.
- von Rogulja P, Kovac W, Schmid H. [metronidazol encephalopathy in rats]. Acta neuropathologica. 1973;25:36-45.
- Alston TA, Abeles RH. Enzymatic conversion of the antibiotic metronidazole to an analog of thiamine. Arch Biochem Biophys. 1987;257:357-362.
- Vezmar S, Becker A, Bode U, Jaehde U. Biochemical and clinical aspects of methotrexate neurotoxicity. Chemotherapy. 2003;49:92-104.
- Quinn CT, Griener JC, Bottiglieri T, Arning E, Winick NJ. Effects of intraventricular methotrexate on folate, adenosine, and homocysteine metabolism in cerebrospinal fluid. J Pediatr Hematol Oncol. 2004;26:386-388.
- Quinn CT, Griener JC, Bottiglieri T, Hyland K, Farrow A, Kamen BA. Elevation of homocysteine and excitatory amino acid neurotransmitters in the csf of children who receive methotrexate for the treatment of cancer. J Clin Oncol. 1997;15:2800-2806.
- Miese FR, Schuster FR, Pierstorff K, Karenfort M, Laws HJ, Borkhardt A, et al. Magnetization transfer imaging provides no evidence of demyelination in methotrexate-induced encephalopathy. AJNR Am J Neuroradiol. 2011;32:E110-112.
- Bega DS, McDaniel LM, Jhaveri MD, Lee VH. Diffusion weighted imaging in heroin-associated spongiform leukoencephalopathy. Neurocrit Care. 2009;10:352-354.
- Bartlett E, Mikulis DJ. Chasing “chasing the dragon” with MRI: Leukoencephalopathy in drug abuse. Br J Radiol. 2005;78:997-1004.
- Geibprasert S, Gallucci M, Krings T. Addictive illegal drugs: Structural neuroimaging. AJNR Am J Neuroradiol. 2010;31:803-808.
- Przeklasa-Auth M, Ovbiagele B, Yim C, Shewmon DA. Multiple sclerosis with initial stroke-like clinicoradiologic features: Case report and literature review. J Child Neurol. 2010;25:732-737.
- Rosso C, Remy P, Creange A, Brugieres P, Cesaro P, Hosseini H. Diffusion-weighted MR imaging characteristics of an acute strokelike form of multiple sclerosis. AJNR Am J Neuroradiol. 2006;27:1006-1008.
- Balashov KE, Aung LL, Dhib-Jalbut S, Keller IA. Acute multiple sclerosis lesion: Conversion of restricted diffusion due to vasogenic edema. J Neuroimaging. 2011;21:202-204.
- Abou Zeid N, Pirko I, Erickson B, Weigand SD, Thomsen KM, Scheithauer B, et al. Diffusion-weighted imaging characteristics of biopsy-proven demyelinating brain lesions. Neurology. 2012;78:1655-1662.
- Werner P, Pitt D, Raine CS. Multiple sclerosis: Altered glutamate homeostasis in lesions correlates with oligodendrocyte and axonal damage. Ann Neurol. 2001;50:169-180.
- Werner P, Pitt D, Raine CS. Glutamate excitotoxicity--a mechanism for axonal damage and oligodendrocyte death in multiple sclerosis? J Neural Transm Suppl. 2000:375-385.
- Stover JF, Pleines UE, Morganti-Kossmann MC, Kossmann T, Lowitzsch K, Kempski OS. Neurotransmitters in cerebrospinal fluid reflect pathological activity. Eur J Clin Invest. 1997;27:1038-1043.159. Tung GA, Rogg JM. Diffusion-weighted imaging of cerebritis. AJNR Am J Neuroradiol. 2003;24:1110-1113.
- Hollinger P, Zurcher R, Schroth G, Mattle HP. Diffusion magnetic resonance imaging findings in cerebritis and brain abscesses in a patient with septic encephalopathy. J Neurol. 2000;247:232-234.
- Ebisu T, Tanaka C, Umeda M, Kitamura M, Naruse S, Higuchi T, et al. Discrimination of brain abscess from necrotic or cystic tumors by diffusion-weighted echo planar imaging. Magn Res Imaging. 1996;14:1113-1116.
- Kamalian S, Kamalian S, Pomerantz SR, Tanpitukpongse TP, Gupta R, Romero JM, et al. Role of cardiac and extracranial vascular ct in the evaluation/management of cerebral ischemia and stroke. Emergency radiology. 2013;20:417-428.
- Giugni E, Sabatini U, Hagberg GE, Formisano R, Castriota-Scanderbeg A. Fast detection of diffuse axonal damage in severe traumatic brain injury: Comparison of gradient-recalled echo and turbo proton echo-planar spectroscopic imaging MRI sequences. AJNR Am J Neuroradiol. 2005;26:1140-1148.
- Hergan K, Schaefer PW, Sorensen AG, Gonzalez RG, Huisman TA. Diffusion-weighted MRI in diffuse axonal injury of the brain. European radiology. 2002;12:2536-2541.
- Edlow BL, Diamond EL. Teaching neuroimages: Restricted diffusion in the corpus callosum after traumatic diffuse axonal injury. Neurology. 2010;75:e69.
- Kinoshita T, Moritani T, Hiwatashi A, Wang HZ, Shrier DA, Numaguchi Y, et al. Conspicuity of diffuse axonal injury lesions on diffusion-weighted MR imaging. Eur J Radiol. 2005;56:5-11.
- Dang NC, Johnson C, Eslami-Farsani M, Haywood LJ. Bone marrow embolism in sickle cell disease: A review. American journal of hematology. 2005;79:61-67.
- Parizel PM, Demey HE, Veeckmans G, Verstreken F, Cras P, Jorens PG, et al. Early diagnosis of cerebral fat embolism syndrome by diffusion-weighted MRI (starfield pattern). Stroke. 2001;32:2942-2944.
- Mossa-Basha M, Izbudak I, Gurda GT, Aygun N. Cerebral fat embolism syndrome in sickle cell anaemia/beta-thalassemia: Importance of susceptibility-weighted MRI. Clinical radiology. 2012;67:1023-1026.
- Zaitsu Y, Terae S, Kudo K, Tha KK, Hayakawa M, Fujima N, et al. Susceptibility-weighted imaging of cerebral fat embolism. Journal of computer assisted tomography. 2010;34:107-112.
- Mangla R, Kolar B, Almast J, Ekholm SE. Border zone infarcts: Pathophysiologic and imaging characteristics. Radiographics. 2011;31:1201-1214.
- Caplan LR, Hennerici M. Impaired clearance of emboli (washout) is an important link between hypoperfusion, embolism, and ischemic stroke. Arch Neurol. 1998;55:1475-1482
- Singhal AB, Hajj-Ali RA, Topcuoglu MA, Fok J, Bena J, Yang D, et al. Reversible cerebral vasoconstriction syndromes: Analysis of 139 cases. Arch Neurol. 2011;68:1005-1012.
- Chen SP, Fuh JL, Wang SJ, Chang FC, Lirng JF, Fang YC, et al. Magnetic resonance angiography in reversible cerebral vasoconstriction syndromes. Ann Neurol. 2010;67:648-656.
- Calabrese LH, Dodick DW, Schwedt TJ, Singhal AB. Narrative review: Reversible cerebral vasoconstriction syndromes. Ann Int Med.. 2007;146:34-44.
- Ducros A, Fiedler U, Porcher R, Boukobza M, Stapf C, Bousser MG. Hemorrhagic manifestations of reversible cerebral vasoconstriction syndrome: Frequency, features, and risk factors. Stroke. 2010;41:2505-2511.
- Feske SK. Posterior reversible encephalopathy syndrome: A review. Seminars in neurology. 2011;31:202-215.
- Lee VH, Wijdicks EF, Manno EM, Rabinstein AA. Clinical spectrum of reversible posterior leukoencephalopathy syndrome. Arch Neurol. 2008;65:205-210.
- Bartynski WS, Grabb BC, Zeigler Z, Lin L, Andrews DF. Watershed imaging features and clinical vascular injury in cyclosporin a neurotoxicity. Journal of computer assisted tomography. 1997;21:872-880.
- Schwartz RB, Bravo SM, Klufas RA, Hsu L, Barnes PD, Robson CD, et al. Cyclosporine neurotoxicity and its relationship to hypertensive encephalopathy: CT and MR findings in 16 cases. AJR Am J Roentgenol. 1995;165:627-631.
- McKinney AM, Short J, Truwit CL, McKinney ZJ, Kozak OS, SantaCruz KS, et al. Posterior reversible encephalopathy syndrome: Incidence of atypical regions of involvement and imaging findings. AJR Am J Roentgenol. 2007;189:904-912.
- Covarrubias DJ, Luetmer PH, Campeau NG. Posterior reversible encephalopathy syndrome: Prognostic utility of quantitative diffusion-weighted MR images. AJNR Am J Neuroradiol. 2002;23:1038-1048.
- Koch S, Rabinstein A, Falcone S, Forteza A. Diffusion-weighted imaging shows cytotoxic and vasogenic edema in eclampsia. AJNR Am J Neuroradiol. 2001;22:1068-1070.
- Cho AH, Suh DC, Kim GE, Kim JS, Lee DH, Kwon SU, et al. MRI evidence of reperfusion injury associated with neurological deficits after carotid revascularization procedures. European J Neurol: The official journal of the European Federation of Neurological Societies. 2009;16:1066-1069.
- Ruscheweyh R, Marziniak M, Evers S. Reversible focal splenial lesions in facial pain patients treated with antiepileptic drugs: Case report and review of the literature. Cephalalgia. 2009;29:587-590.
- Arbelaez A, Pajon A, Castillo M. Acute marchiafava-bignami disease: MR findings in two patients. AJNR Am J Neuroradiol. 2003;24:1955-1957.
- Menegon P, Sibon I, Pachai C, Orgogozo JM, Dousset V. Marchiafava-bignami disease: Diffusion-weighted MRI in corpus callosum and cortical lesions. Neurology. 2005;65:475-477.
- Pekala JS, Mamourian AC, Wishart HA, Hickey WF, Raque JD. Focal lesion in the splenium of the corpus callosum on flair mr images: A common finding with aging and after brain radiation therapy. AJNR Am J Neuroradiol. 2003;24: 855-861.
Citation
S K, S K, DJ B, MH L, RG G, PW S. Stroke differential diagnosis and mimics: Part 2. Appl Radiol. 2015;(11):39A-39I.
November 3, 2015