New PET tracers for dementia evaluation: Coming to your clinic now
Images
Alzheimer’s disease (AD) is the most common neurodegenerative disorder, and cases of AD continue to rise, posing a significant clinical and financial challenge for the upcoming years. The National Institute on Aging and Alzheimer’s Association recently updated the protocol for AD diagnosis to include abnormal tracer retention on amyloid positron emission tomography (PET) imaging, low amyloid-beta (Aβ) and elevated tau in cerebrospinal fluid, brain atrophy as indicated with magnetic resonance imaging (MRI), and hypometabolism shown through fluorodeoxyglucose (FDG) PET as biomarkers for the disease.
We will review current literature on 2 commonly utilized amyloid imaging tracers, carbon-11-labeled Pittsburgh compound-B (PiB-C11) and florbetapir-F18 and we will evaluate the utility of amyloid imaging in AD diagnosis and identify the limitations of amyloid imaging that must be addressed or improved before this tool can significantly alter the diagnostic work up of patients. We will also present a decision-tree model that outlines the optimal diagnostic tools to utilize for the most effective management of patients presenting with symptoms of dementia.
Background
AD is a progressive neurodegenerative disease afflicting 5.4 million Americans, including 1 in 8 people over the age of 65.1 It is estimated that the number of people with AD will triple by 2050, reaching 11 to 16 million, as a result of longer life expectancies and aging baby boomers. AD is also a significant public-health concern as it is the sixth leading cause of death in the United States and has a long duration, with 80% of care provided by caregivers at home, who report increased physical and emotional stress.1 Furthermore, it poses a considerable financial challenge as the burden of care for 2012 is approximately $200 billion and is projected to increase to $1.1 trillion by 2050, with the cost primarily attributable to hospital stays, skilled nursing facility stays, and home health care visits.
Progression of the disease can be slowed with pharmacological agents like donepezil, galantamine, and rivastigmine, which can temporarily stabilize cognitive decline if prescribed early on in the disease process.2 Accurate and early AD diagnosis has significant value because it allows for timelier therapeutic intervention. Mild cognitive impairment (MCI) is a diagnosis for patients displaying greater mental deterioration than considered normal for their age. These individuals may gradually transition to dementia. Longitudinal studies evaluating the rate of conversion from MCI to dementia affirm that on average, 10% to 15% of subjects will decline to dementia a year after initial diagnosis, with 60% to 65% of MCI subjects developing dementia within their lifetime.3
Major risk factors for AD include increasing age, as 95% of cases are late-onset AD, which occurs after 65 years. Additionally, genetic background is also a risk factor. The E4 allele of apolipoprotein E genes, which code for a protein involved in metabolizing cholesterol, increase the risk of developing AD and lower the age of AD onset, while contributing to beta-amyloid (Aβ)-42 aggregation and clearance.4,5
AD is characterized by senile amyloid plaques, as well as neurofibrillary tangles that form due to hyperphosphorylation of tau. The tangles are intracellular aggregates involving disassociation from microtubules; they begin in the entorhinal cortex and progress sequentially to the hippocampus, paralimbic and medial-basal temporal cortex, neocortical association areas, and primary sensorimotor and visual areas. Aβ peptide is formed after β and γ secretase cleavage of amyloid precursor protein.6 Aβ proteins become insoluble, misfold, and aggregate as Aβ plaques, which is followed by events like neurofibrillary tangles, inflammation, oxidative stress, loss of synaptic connections, and, eventually, cell death.7 Unlike in normal subjects, the insoluble Aβ peptides are 100 times higher in concentration than the Aβ-soluble forms in patients with AD.8 AD lesions occur years before cognitive deficits become apparent and eventually accumulate and manifest in the form of dementia. The onset of Aβ plaques appears to represent an early event in the AD pathological cascade.
New AD diagnosis guidelines
Dementia is defined by a combination of impairment in multiple cognitive domains that compromise the ability to function. The Diagnostic Statistical Manual guidelines have recently been revised to include two categories of dementia: mild neurocognitive disorder and major neurocognitive disorder.9 According to these standards, AD diagnosis can be made for patients who meet the criteria for major neurocognitive disorder and have a gradual onset and progression of cognitive decline in memory and another cognitive domain that interferes with independence. Dementia is nonspecific, and the clinical phenotype of AD overlaps with other diseases that produce similar brain abnormalities. Beach et al utilized data from the National Alzheimer’s Coordinating Center collected from over 30 Alzheimer’s disease centers to assess the accuracy rates of clinical diagnosis of AD over a period of 5 years since 2005. Using neuropathologic diagnosis as a gold standard, the sensitivity for AD diagnosis ranged from 70.9% to 87.3%, while the specificity ranged from 44.3% to 70.8%. Sensitivity was enhanced when probable or possible AD also served as the clinical diagnosis, while specificity increased when only “probable AD” was accepted for clinical diagnosis.10 The accuracy rates vary based on the neuropathologic or clinical criteria used, emphasizing the need for specific and accurate biomarkers that may increase the clinical diagnostic accuracy of AD.
Though the definition of AD has been evolving, the National Institute on Aging and Alzheimer’s Association revised the 1984 AD research criteria by expanding AD into 3 phases (preclinical, predementia, and dementia) and incorporating biomarkers to provide information about the underlying pathology of the disease that will allow for early detection and evaluation of disease progression. According to that scheme, the preclinical or asymptomatic stage is characterized by Aβ plaques and elevated tau.11 Biomarkers for the prodromal stage include abnormal tracer retention on amyloid-PET imaging and low cerebrospinal fluid (CSF) Aβ-42. These are important as they can reveal information about the underlying pathophysiology of AD that is not available with neuropsychological or clinical assessments. The predementia or symptomatic phase is characterized by a mild decline in cognition that does not impact function or compromise daily activities.12 The dementia phase is reserved for those subjects whose memory or cognitive impairment interferes with independence.13 Dementia is further broken down into probable or possible AD. Biomarkers of neuronal degeneration include elevated CSF tau or Aβ, hypometabolism in the temporal and parietal cortex of a PET scan, and brain atrophy in medial temporal lobes, paralimbic, temporal, and parietal cortex on structural MRI. If any of the biomarkers of neuronal injury or Aβ deposition are positive, the likelihood of AD is elevated, but if they are in conflict, the biomarkers are less informative. These biomarkers can enhance diagnostic accuracy and add incremental information about the disease pathology that can explain patients’ symptoms.
The authors’ objective is to examine current literature on amyloid imaging for AD, explore the clinical applications of amyloid imaging, and assess the advantages and limitations of amyloid PET in a clinical setting. We evaluate the role of various biomarkers on the diagnosis of dementia and also present recommendations, including a model based on the neurodegenerative process, which can benefit patients by guiding clinicians on the appropriate diagnostic tools to administer depending on each patient’s individual assessment.
Pittsburgh compound-B
The most well-studied tracer for Aβ imaging is PiB-C11, a thioflavin analog which binds to extracellular amyloid plaques and vascular amyloid deposits. High uptake is consistently found in the prefrontal cortex, precuneus and posterior cingulate cortex, followed closely by the lateral parietal, lateral temporal cortex, and striatum.14 There is high concordance between low levels of cerebrospinal fluid Aβ-42 and positive PiB PET findings.15 Further, in contrast to normal subjects, symptomatic AD patients display higher PiB binding. Several studies report that PiB can differentiate AD individuals from healthy controls and predict the likelihood of conversion from MCI to AD.16 Edison et al evaluated 19 AD subjects and 14 controls that had PiB (C-11) imaging, of which 12 AD and 8 controls also had FDG-PET scans. Though PiB detected an increased amyloid burden in 89% of patients with AD, a high amyloid load was also detected in the frontal lobe, despite spared glucose metabolism. A possible explanation for this discrepancy is that amyloid plaque formation does not directly instigate neuronal dysfunction.17 Some of the difficulties faced with amyloid imaging are illustrated by this study. The lack of correlation between metabolic levels found on FDG PET versus amyloid deposition in the frontal lobe and high frontal-uptake values is contradictory to histopathological data that shows the frontal lobe has an intermediary position on the neurodegenerative cascade and is not usually impacted in the early stages of the disease.18 Additionally, PiB binds to both diffuse and neuritic plaques, which may affect the in vivo signal.
Florbetapir-F18
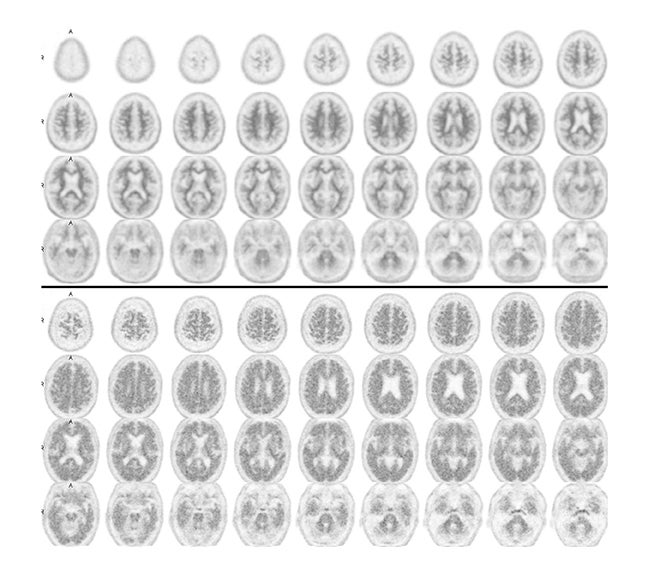
Due to the short 20-minute half-life of carbon 11, tracers labeled with fluorine-18, which display a longer half-life, have enabled amyloid imaging to be used clinically. The first FDA-approved and most widely used radiotracer for in-vivo identification of Aβ plaques is florbetapir-F18 (AV-45), which displays high binding affinity, effective brain penetration, and selective labeling of Aβ plaques.19 Negative florbetapir PET scans are marked by predominant white matter retention, while positive scans display increasing grey matter retention (Figure 1). Studies examining patients who received both AV-45 and PiB scans report that they provide analogous information as they have similar binding characteristics, nonspecific binding, and the ability to discriminate between normal and mild AD subjects, with only minor differences like a larger range of standardized uptake value ratios for PiB PET scans.20 Other F-18 labeled amyloid imaging tracers are currently under development. In particular, flutemetamol (GE-067), a 3’-fluoro analog of PIB, and florbetaben (BAY-94-9172, AV-1), a derivative of stilbene, whose imaging time goes up to 130 minutes following injection, are in Phase 3 of clinical development.21 Studies report these tracers display high-binding affinity that is comparable to PiB and report associations between in-vivo brain PET imaging and postmortem analysis of brain tissue.
In a prospective cohort study composed of 59 normal to advanced dementia participants, Clark et al compared florbetapir to neuropathology at autopsy for detection of Aβ plaques and found a close association between tracer uptake and amyloid pathology, suggesting amyloid imaging can be used to assess the presence of amyloid aggregate in cognitive impairment. The sensitivity and specificity of florbetapir for detection of moderate to frequent plaques were 92% and 100% in people who had an autopsy within 2 years of imaging and 96% and 100% for those whose autopsy was within 1 year after imaging. Amyloid assessed with PET was correlated with postmortem amyloid burden (Spearman ρ=0•76; p<0•0001 for 2-year subjects; 0•79; p<0•0001 for 1-year subjects).22
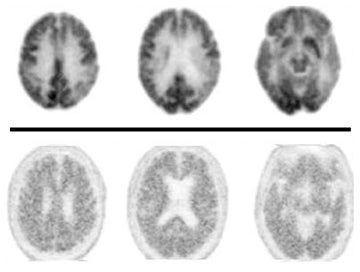
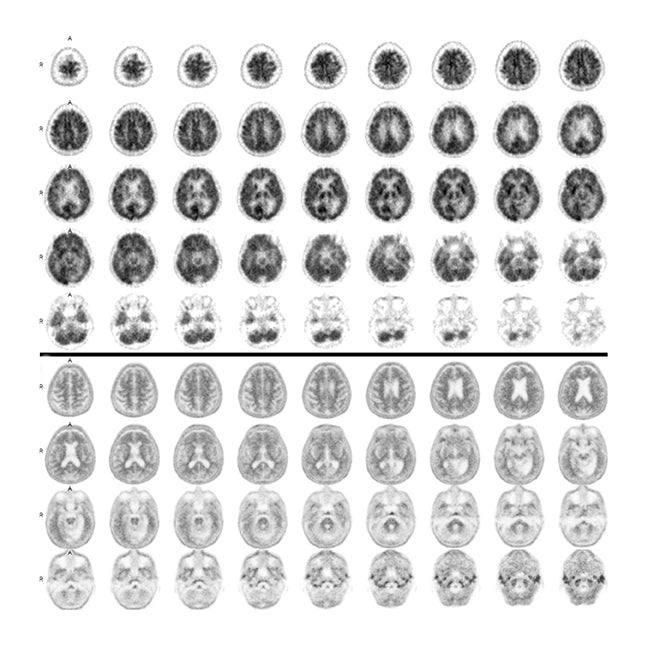
Some clinical cases where patients underwent both FDG-PET and florbetapir imaging are shown in Figures 2 and 3. The first case involves a 74-year-old man with some memory loss and prominent word-finding difficulties clinically consistent with primary progressive aphasia (PPA). This is a condition that most commonly occurs as a subtype of frontotemporal dementia (FTD), but can also represent a subtype of AD. While the AD subtype has been associated with a logopenic form of PPA, the clinical distinction is not reliable. Figure 2 shows side-by-side images of his FDG-PET and florbetapir brain PET scans. The robust posterior cingulate metabolism in the FDG scan weighs against AD. Had the amyloid scan been negative, this would have been strongly confirmatory. On the other hand, the positive amyloid scan does not contribute strongly to the AD versus FTD distinction, since positive scans often occur in the absence of overt AD, particularly in older subjects. In contrast, in Figure 3, FDG and florbetapir scans of an 80-year-old woman with prior left temporal and occipital infarcts with worsening memory loss are both negative for AD, making superimposition of an Alzheimer-like process an unlikely explanation for her progressive memory problems.
Limitations of amyloid imaging
Despite the high degrees of sensitivity and specificity reported by such studies, these results must be interpreted with caution as several confounding factors are involved. Moghbel et al reviewed the feasibility of Aβ imaging and reported that in addition to consistent findings of high standard-uptake values in the frontal lobe, the possibility of dissimilar surface structures due to the differential precipitation of Aβ depending on the stage of the disease or region of the brain further raises questions about the specificity of amyloid radiotracers.18 Other factors that would be useful to address before Aβ can be optimally integrated is the nonspecific binding of radiotracers to white matter, which diverges from results of immunohistochemical tests, and the lack of partial volume correction by many groups, leading to underestimated standardized uptake-value data in the literature. Thus, more effective imaging of Aβ deposition and better reproducibility across multiple subjects and clinical settings are crucial and must be achieved for an accurate understanding of the prognostic implications of amyloid and for accurate cross-center comparisons. Additionally, more research aimed at understanding the prognostic value of moderate Aβ plaques is crucial. For instance, Sojkova et al reported that in 6 participants, though there was agreement between in-vivo imaging and a neuritic plaque score for those patients with high or negligible Aβ levels in vivo, only limited agreement was observed for those with intermediate levels of Aβ, emphasizing the need for better understanding of the correlation between imaging and pathologic assessment.23 Quantification of regional Aβ can help elucidate this information, but standardization of quantitative measures is essential.15 Furthermore, variations in the highest acceptable Aβ-deposition values hinder accurate assessments of amyloid imaging and emphasize the need for a threshold level of global Aβ deposition that can differentiate between clearly abnormal versus normal scans.24 More studies looking at the inter-rater and intra-rater reliability of visual interpretations and establishment of a quantitative threshold for defining a positive scan are needed.14
Aβ plaques plateau, while downstream biomarkers of neurodegeneration and cognition become abnormal later and correlate with clinical symptom severity, suggesting that Aβ is not the direct cause of cognitive impairment.25 Jack et al evaluated 218 MCI subjects enrolled in the Alzheimer’s Disease Neuroimaging Initiative and found that those subjects designated amyloid-positive were more likely to progress to dementia than those in the amyloid-negative group (50% versus 19%). Hippocampal atrophy predicted a shorter time to progression for the amyloid-positive group, and the Aβ load had comparable power in the pooled group. The risk profile was linear throughout the range of hippocampal atrophy values, but plateaued at high Aβ levels, confirming that Aβ is not the direct cause of impairment as it does not match risk of progression at high levels.26 Additionally, Wolk et al stated that patients with MCI have a similar degree of PiB uptake as AD patients, which indicates that accumulation of amyloid plaques occurs before the progression to AD.7,24 Consequently, this data suggests that other structural or functional imaging techniques like FDG-PET, which measures glucose metabolism, may be better predictors of which subjects will convert from MCI to AD as they can properly assess where the patient is on the neurodegenerative pathway.
Guidelines for diagnosis
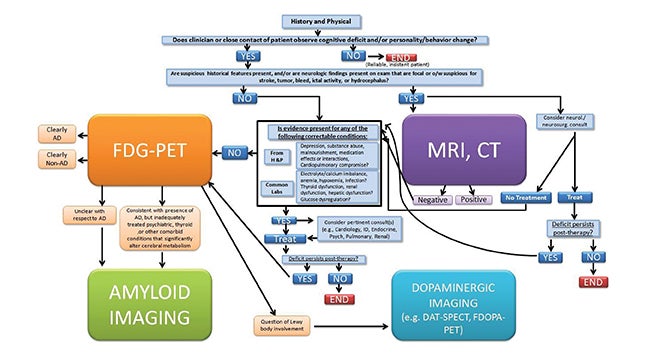
In a review about guidelines for diagnosis, Galvin et al stated that an estimated 50% of patients older than 65 years are not properly diagnosed by their primary care physicians.27 To help ameliorate such cases of underdiagnosis or misdiagnosis, we recommend the following protocol for patients presenting with dementia symptoms (Fig- ure 4). For optimal usage of imaging biomarkers, we propose that patients first receive laboratory and cognitive tests, followed by neuroimaging and specifically FDG-PET if the deficits persist. Amyloid imaging should be used in cases when the PET scan cannot be used to differentiate between AD or non-AD or if the patient presents with syndromes that mimic dementia like depression or thyroid disease that’s not fully treated. Dopaminergic imaging should be considered for patients whose FDG-PET implies Lewy bodies may be involved. By the time episodic memory is impaired, amyloid load has plateaued, while neurodegenerative markers continue to worsen.28 LaForce et al suggest that stratifying MCI patients into those with or without the possibility of underlying AD may be the major use of amyloid imaging. They further suggest that the technique will be useful for patients with early age-of-onset dementia as these patients often have atypical symptoms, and the main alternative cause of dementia in that age group is frontotemporal lobar degeneration, a non-Aβ disease.
Conclusion
To summarize, before amyloid imaging can significantly enhance diagnostic accuracy or alter the diagnostic work up of patients, several issues must be resolved, including enhanced correlations between sensitivity/specificity and pathology and a threshold value that can differentiate positive and negative scans. Additional longitudinal studies with greater numbers of subjects are also critical for understanding the most appropriate use of amyloid imaging in the diagnosis of AD and for the prediction of progression to dementia. Amyloid burden plateaus, but may be followed by events that are more closely tied to cognitive decline, changes that may be evaluated with FDG-PET.
As the prevalence of AD continues to increase, there will be a heightened demand for more research and clinical implementation of research findings, better elucidating the clinical value of identifying Aβ plaques. Imaging-based biomarkers can ultimately increase our understanding of the underlying pathological mechanisms at play in AD, while also potentially enhancing a patient’s quality of life by allowing effective therapeutic interventions that can stabilize or delay progression of disease.
REFERENCES
- Eheman C, Henley SJ, Ballard-Barbash R, et al. Annual Report to the Nation on the status of cancer, 1975-2008, featuring cancers associated with excess weight and lack of sufficient physical activity. Cancer. 2012;118:2338-2366.
- Hansen RA, Gartlehner G, Webb AP, et al. Efficacy and safety of donepezil, galantamine, and rivastigmine for the treatment of Alzheimer’s disease: a systematic review and meta-analysis. Clin Interv Aging. 2008;3:211-225.
- Busse A, Angermeyer MC, Ridele-Heller SG. Progression of mild cognitive impairment to dementia: A challenge to current thinking. Br J Psychiatry. 2006;189:399-404.
- Lopez OL. The growing burden of Alzheimer’s disease. Am J Manag Care. 2011;17 Suppl 13:S339-345.
- Kim J, Basak JM, Holtzman DM. The role of apolipoprotein E in Alzheimer’s disease. Neuron. 2009;63:287-303.
- Di Carlo M, Giacomazza D, San Biagio PL. Alzheimer’s disease: Biological aspects, therapeutic perspectives and diagnostic tools. J Phys Condens Matter. 2012;24:244102.
- Vlassenko AG, Benzinger TL, Morris JC. PET amyloid-beta imaging in preclinical Alzheimer’s disease. Biochim Biophys Acta. 2012;1822:370-379.
- Mirra SS, Heyman A, McKeel D, et al. The consortium to establish a registry for Alzheimer’s disease (CERAD). Part II. Standardization of the neuropathologic assessment of Alzheimer’s disease. Neurology. 1991;41:479-486.
- Neurocognitive Disorders 2012. http://www.dsm5.org/proposedrevision/pages/neurocognitivedisorders.aspx. Accessed March 30, 2012.
- Beach TG, Monsell SE, Phillips LE, Kukull W. Accuracy of the clinical diagnosis of Alzheimer disease at National Institute on Aging Alzheimer Disease Centers, 2005-2010. J Neuropathol Exp Neurol. 2012;71:266-273.
- Sperling RA, Aisen PS, Beckett LA, et al. Toward defining the preclinical stages of Alzheimer’s disease: Recommendations from the National Institute on Aging—Alzheimer’s Association workgroups on diagnostic guidelines for Alzheimer’s disease. Alzheimers Dement. 2011;7:280-292.
- Albert MS, DeKosky ST, Dickson D, et al. The diagnosis of mild cognitive impairment due to Alzheimer’s disease: Recommendations from the National Institute on Aging-Alzheimer’s Association workgroups on diagnostic guidelines for Alzheimer’s disease. Alzheimers Dement. 2011;7:270-279.
- McKhann GM, Knopman DS, Chertkow H, et al. The diagnosis of dementia due to Alzheimer’s disease: Recommendations from the National Institute on Aging-Alzheimer’s Association workgroups on diagnostic guidelines for Alzheimer’s disease. Alzheimers Dement. 2011;7:263-269.
- Laforce R, Jr., Rabinovici GD. Amyloid imaging in the differential diagnosis of dementia: Review and potential clinical applications. Alzheimers Res Ther. 2011;3:31.
- Jack CR, Jr. Alzheimer disease: New concepts on its neurobiology and the clinical role imaging will play. Radiology. 2012;263:344-361.
- Forsberg A, Engler H, Almkvist O, et al. PET imaging of amyloid deposition in patients with mild cognitive impairment. Neurobiol Aging. 2008;29:1456-1465.
- Edison P, Archer HA, Hinz R, et al. Amyloid, hypometabolism, and cognition in Alzheimer disease: An [11C]PIB and [18F]FDG PET study. Neurology. 2007;68:501-508.
- Moghbel M, Saboury B, Basu S, et al. Amyloid-ß imaging with PET in Alzheimer’s disease: Is it feasible with current radiotracers and technologies? Eur J Nucl Med Mol Imaging. 2012;39:202-208.
- Shim YS, Morris JC. Biomarkers predicting Alzheimer’s disease in cognitively normal aging. J Clin Neurol. 2011;7:60-68.
- Wolk DA, Zhang Z, Boudhar S, et al. Amyloid imaging in Alzheimer’s disease: Comparison of florbetapir and Pittsburgh compound-B positron emission tomography. J Neurol Neurosurg Psychiatry. 2012;83:923-926.
- Herholz K, Ebmeier K. Clinical amyloid imaging in Alzheimer’s disease. Lancet Neurol. 2011; 10:667-670.
- Clark CM, Schneider JA, Bedell BJ, et al. Use of florbetapir-PET for imaging beta-amyloid pathology. JAMA. 2011;305:275-283.
- Sojkova J, Driscoll I, Iacono D, et al. In vivo fibrillar beta-amyloid detected using [11C]PiB positron emission tomography and neuropathologic assessment in older adults. Arch Neurol. 2011;68:232-240.
- Wolk DA, Klunk W. Update on amyloid imaging: From healthy aging to Alzheimer’s disease. Curr Neurol Neurosci Rep. 2009;9:345-352.
- Jack CR, Jr., Knopman DS, Jagust WJ, et al. Hypothetical model of dynamic biomarkers of the Alzheimer’s pathological cascade. Lancet Neurol. 2010;9:119-128.
- Jack CR, Jr., Wiste HJ, Vemuri P, et al. Brain beta-amyloid measures and magnetic resonance imaging atrophy both predict time-to-progression from mild cognitive impairment to Alzheimer’s disease. Brain. 2010;133:3336-3348.
- Galvin JE, Sadowsky CH, NINCDS-ADRDA Practical guidelines for the recognition and diagnosis of dementia. J Am Board Fam Med. 2012;25:367-382.
- Gelosa, G, Brooks DJ. The prognostic value of amyloid imaging. Eur J Nucl Med Mol Imaging. 2012;39:1207-1219.